U.S. Census Bureau · CPS/HVS
Rental Vacancy Rates by State
See how much rental housing is vacant, and how each state's rate has changed over twenty years.
Annual estimates · 2005–2025 · rental inventory only
Explore every state ↓2025 · annual CPS/HVS
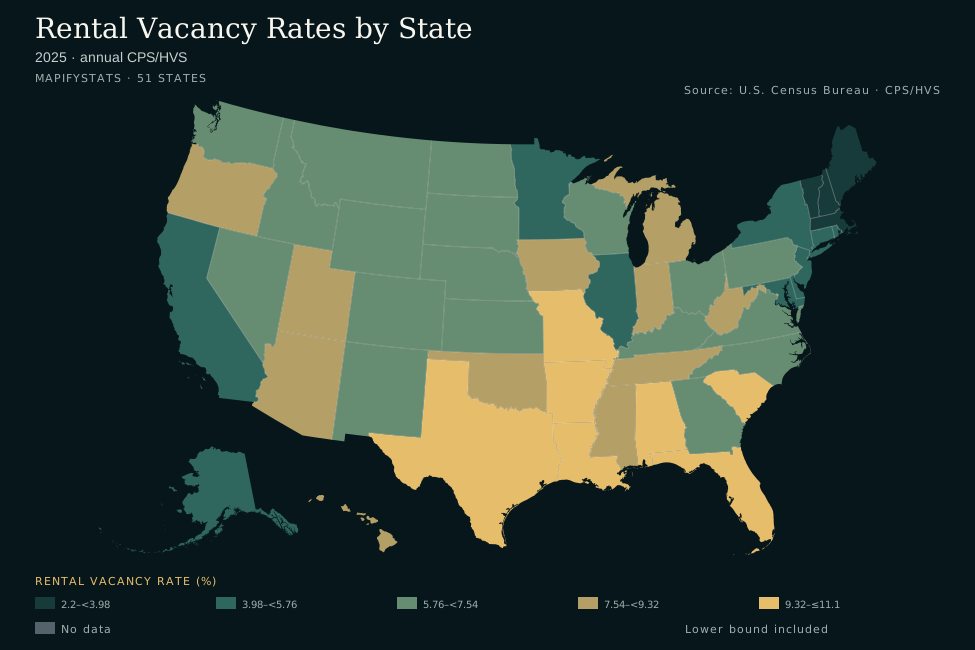
- 2.2–<3.98
- 3.98–<5.76
- 5.76–<7.54
- 7.54–<9.32
- 9.32–≤11.1
- No data
- Lower bound included
State estimates and source notes are available below. Enable JavaScript for interactive comparisons.
Compare two states
Historical comparison
Scroll the chart horizontally to see the full period →
View chart values as a table
All 50 states and DC
Louisiana has the highest selected point estimate (11.1%); Maine has the lowest (2.2%).
2025 · annual CPS/HVS
Scroll horizontally to see every column →
| Alabama | 9.5% | -0.6 pp | 6 |
|---|---|---|---|
| Alaska | 5.3% | 0.4 pp | 40 |
| Arizona | 8.4% | -0.4 pp | 12 |
| Arkansas | 10.1% | 0.3 pp | 4 |
| California | 4.8% | 0.0 pp | 44 |
| Colorado | 5.8% | 1.3 pp | 36 |
| Connecticut | 4.7% | 1.8 pp | 45 |
| Delaware | 5.6% | 1.8 pp | 39 |
| District of Columbia | 7.9% | 1.1 pp | Unranked |
| Florida | 10.2% | 0.2 pp | 3 |
| Georgia | 6.6% | -1.7 pp | 23 |
| Hawaii | 8.7% | 1.3 pp | 10 |
| Idaho | 6.2% | 1.1 pp | 31 |
| Illinois | 5.7% | -0.8 pp | 37 |
| Indiana | 8.9% | -1.0 pp | 8 |
| Iowa | 7.9% | -0.1 pp | 14 |
| Kansas | 6.4% | 1.0 pp | 29 |
| Kentucky | 6.6% | -0.3 pp | 23 |
| Louisiana | 11.1% | 1.7 pp | 1 |
| Maine | 2.2% | -0.7 pp | 50 |
| Maryland | 5.7% | 0.0 pp | 37 |
| Massachusetts | 3.4% | 0.2 pp | 48 |
| Michigan | 8.0% | 1.2 pp | 13 |
| Minnesota | 5.1% | -0.3 pp | 42 |
| Mississippi | 7.6% | 0.0 pp | 16 |
| Missouri | 9.4% | 0.7 pp | 7 |
| Montana | 5.9% | 1.7 pp | 33 |
| Nebraska | 5.9% | 0.5 pp | 33 |
| Nevada | 6.5% | -1.6 pp | 28 |
| New Hampshire | 3.9% | -0.1 pp | 47 |
| New Jersey | 4.9% | 1.3 pp | 43 |
| New Mexico | 6.6% | 0.0 pp | 23 |
| New York | 5.3% | -0.2 pp | 40 |
| North Carolina | 6.4% | 0.0 pp | 29 |
| North Dakota | 7.3% | -0.5 pp | 19 |
| Ohio | 5.9% | 0.1 pp | 33 |
| Oklahoma | 7.7% | -0.2 pp | 15 |
| Oregon | 7.6% | 0.9 pp | 16 |
| Pennsylvania | 6.6% | -0.3 pp | 23 |
| Rhode Island | 4.0% | 1.4 pp | 46 |
| South Carolina | 9.8% | -0.8 pp | 5 |
| South Dakota | 6.7% | -0.9 pp | 22 |
| Tennessee | 8.7% | 0.5 pp | 10 |
| Texas | 11.0% | 1.8 pp | 2 |
| Utah | 7.6% | 2.8 pp | 16 |
| Vermont | 3.0% | -0.7 pp | 49 |
| Virginia | 6.0% | 0.4 pp | 32 |
| Washington | 6.6% | 0.6 pp | 23 |
| West Virginia | 8.9% | -0.9 pp | 8 |
| Wisconsin | 7.1% | 3.0 pp | 20 |
| Wyoming | 7.1% | 1.6 pp | 20 |
Download every source observation as CSV ↓ · Explorer data (JSON)
What does rental vacancy measure?
The rental vacancy rate is the share of rental inventory that is vacant and available for rent. Its denominator includes occupied rentals and units vacant for rent; it is not the share of every home that is empty. Seasonal homes, units for sale and other kinds of vacancy answer different questions. A lower rate can indicate fewer available rentals, but the rate alone does not establish rents, profitability or local market conditions.
Read the trend before the rank
A state's annual estimate can move substantially from year to year. Use the trend chart and compare nearby years before interpreting a single rank. State averages can hide very different metro and neighborhood markets. Small differences between states may reflect sampling uncertainty; this explorer ranks point estimates, with tied values sharing a rank. DC is included in maps and downloads, but excluded from the 50-state ranking.
Methodology and uncertainty
The archived Census CPS/HVS annual Table 3 supplies the published 2005–2025 state estimates. Changes are calculated in percentage points, by subtracting the previous year's rate. The annual table does not publish a margin of error for every observation; those uncertainties and derived change margins are unavailable here. Annual 2025 estimates use 11 months: October data were not collected during the lapse in federal funding. Pandemic-era collection changes also affect comparisons involving 2020. Annual estimates must not be compared as if they were quarterly observations.
Source and reproducibility
U.S. Census Bureau · CPS/HVS. Sources retrieved October 1, 2026. The snapshot stays fixed until a reviewed data refresh; this page does not claim live data.
Archived source files, selection rules and SHA-256 checksums.
Common questions
Does a high vacancy rate mean housing is affordable?
No. Vacancy measures rental availability; affordability also depends on rents and household incomes.
Why is there no previous-year change for 2005?
The archived explorer begins in 2005, so the 2004 comparison is unavailable. The 2005 vacancy rate is still shown.