U.S. Census Bureau · ACS 2024 1-year
HOA and Condo Fees by State
See how monthly dues compare with your state, and how common association fees are.
2024 ACS 1-year · required HOA and condo fees combined · owner-occupied homes
Explore every state ↓2024 · ACS 1-year estimates
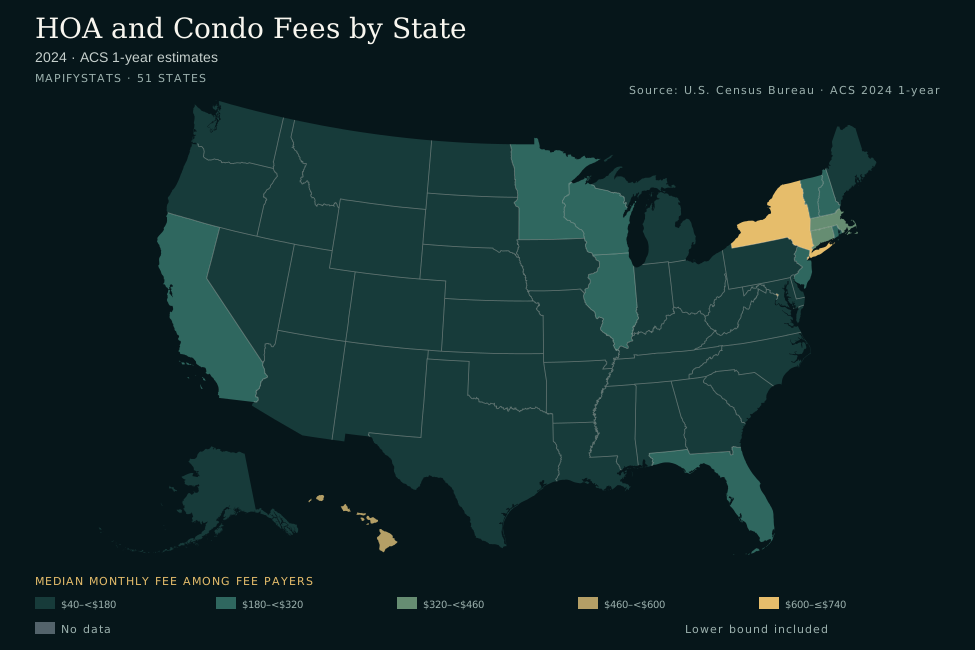
- $40–<$180
- $180–<$320
- $320–<$460
- $460–<$600
- $600–≤$740
- No data
- Lower bound included
State estimates and source notes are available below. Enable JavaScript for interactive comparisons.
Compare two states
Compare your monthly dues
Enter your dues to compare with fee-paying homes in the first selected state.
Published ranges support a range comparison, not an exact personal percentile. Amenities, building type and services vary. Entries stay in this page and are not included in shared URLs.
Historical comparison
Scroll the chart horizontally to see the full period →
View chart values as a table
All 50 states and DC
New York has the highest selected point estimate ($739); Arkansas has the lowest ($47).
2024 · ACS 1-year estimates
Scroll horizontally to see every column →
| Alabama | $52 | $624 | 17.0% | 6.3% | 248,471 | ±$4 | 46 |
|---|---|---|---|---|---|---|---|
| Alaska | $135 | $1,620 | 16.2% | 12.2% | 29,565 | ±$25 | 17 |
| Arizona | $98 | $1,176 | 44.7% | 3.4% | 903,170 | ±$2 | 26 |
| Arkansas | $47 | $564 | 12.1% | 3.9% | 100,928 | ±$3 | 50 |
| California | $278 | $3,336 | 23.7% | 19.8% | 1,828,720 | ±$4 | 8 |
| Colorado | $99 | $1,188 | 42.4% | 7.5% | 692,711 | ±$3 | 24 |
| Connecticut | $351 | $4,212 | 15.5% | 22.4% | 149,928 | ±$7 | 4 |
| Delaware | $85 | $1,020 | 40.5% | 4.8% | 123,248 | ±$12 | 31 |
| District of Columbia | $505 | $6,060 | 38.6% | 50.4% | 51,999 | ±$44 | Unranked |
| Florida | $230 | $2,760 | 44.3% | 23.1% | 2,754,170 | ±$4 | 11 |
| Georgia | $99 | $1,188 | 33.1% | 12.5% | 927,672 | ±$3 | 24 |
| Hawaii | $470 | $5,640 | 42.0% | 47.8% | 127,688 | ±$27 | 2 |
| Idaho | $61 | $732 | 30.9% | 5.6% | 166,121 | ±$3 | 38 |
| Illinois | $237 | $2,844 | 23.6% | 15.1% | 814,724 | ±$4 | 10 |
| Indiana | $61 | $732 | 22.2% | 5.2% | 435,198 | ±$3 | 38 |
| Iowa | $128 | $1,536 | 11.2% | 3.7% | 107,385 | ±$11 | 19 |
| Kansas | $65 | $780 | 20.9% | 9.5% | 171,654 | ±$3 | 37 |
| Kentucky | $70 | $840 | 14.7% | 5.4% | 186,936 | ±$7 | 36 |
| Louisiana | $61 | $732 | 14.8% | 6.3% | 186,266 | ±$4 | 38 |
| Maine | $169 | $2,028 | 8.0% | 9.4% | 35,933 | ±$43 | 14 |
| Maryland | $104 | $1,248 | 37.7% | 10.4% | 613,485 | ±$3 | 23 |
| Massachusetts | $376 | $4,512 | 16.8% | 29.0% | 297,063 | ±$8 | 3 |
| Michigan | $125 | $1,500 | 18.1% | 7.2% | 548,021 | ±$8 | 20 |
| Minnesota | $269 | $3,228 | 16.1% | 13.6% | 272,302 | ±$6 | 9 |
| Mississippi | $53 | $636 | 13.0% | 5.7% | 107,683 | ±$5 | 44 |
| Missouri | $54 | $648 | 25.3% | 7.3% | 444,054 | ±$3 | 42 |
| Montana | $53 | $636 | 19.0% | 2.4% | 61,125 | ±$8 | 44 |
| Nebraska | $54 | $648 | 18.1% | 4.3% | 99,240 | ±$7 | 42 |
| Nevada | $95 | $1,140 | 51.3% | 3.1% | 382,060 | ±$3 | 27 |
| New Hampshire | $316 | $3,792 | 14.8% | 9.8% | 61,299 | ±$11 | 5 |
| New Jersey | $300 | $3,600 | 20.5% | 17.7% | 464,095 | ±$6 | 7 |
| New Mexico | $61 | $732 | 15.1% | 2.9% | 92,064 | ±$4 | 38 |
| New York | $739 | $8,868 | 14.3% | 64.4% | 607,646 | ±$19 | 1 |
| North Carolina | $79 | $948 | 29.4% | 4.8% | 883,625 | ±$3 | 33 |
| North Dakota | $157 | $1,884 | 7.7% | 1.7% | 16,459 | ±$17 | 15 |
| Ohio | $124 | $1,488 | 17.0% | 6.6% | 568,689 | ±$7 | 21 |
| Oklahoma | $48 | $576 | 19.8% | 5.9% | 208,416 | ±$2 | 48 |
| Oregon | $88 | $1,056 | 16.2% | 9.3% | 178,558 | ±$5 | 29 |
| Pennsylvania | $148 | $1,776 | 12.6% | 10.1% | 467,781 | ±$5 | 16 |
| Rhode Island | $314 | $3,768 | 9.9% | 14.4% | 28,309 | ±$15 | 6 |
| South Carolina | $94 | $1,128 | 34.4% | 8.6% | 553,601 | ±$4 | 28 |
| South Dakota | $86 | $1,032 | 10.0% | 2.2% | 26,128 | ±$25 | 30 |
| Tennessee | $79 | $948 | 18.8% | 3.8% | 367,794 | ±$4 | 33 |
| Texas | $76 | $912 | 34.3% | 11.5% | 2,443,891 | ±$2 | 35 |
| Utah | $135 | $1,620 | 22.4% | 3.5% | 184,364 | ±$6 | 17 |
| Vermont | $221 | $2,652 | 10.9% | 11.5% | 22,713 | ±$21 | 12 |
| Virginia | $123 | $1,476 | 34.0% | 8.4% | 786,094 | ±$3 | 22 |
| Washington | $82 | $984 | 26.2% | 14.0% | 522,731 | ±$4 | 32 |
| West Virginia | $48 | $576 | 11.4% | 4.3% | 63,778 | ±$3 | 48 |
| Wisconsin | $184 | $2,208 | 10.5% | 6.9% | 180,639 | ±$11 | 13 |
| Wyoming | $52 | $624 | 12.8% | 7.3% | 23,454 | ±$9 | 46 |
Download every source observation as CSV ↓ · Explorer data (JSON)
Median fees among owners who pay
The monthly median comes from ACS B25143 for owner-occupied homes paying a required homeowners association and/or condominium fee. Annualized fees multiply that median by 12. The published measure combines HOA fees, condo fees and homes paying both; it cannot separate these into pure HOA and pure condo averages. A median is the midpoint, not an arithmetic average.
Two different denominators
The share paying a required fee divides fee-paying owner households by all owner households (B25142). The $500-or-more share divides households in fee ranges starting at $500 by fee-paying owner households. These percentages answer different questions. The fee-distribution chart also uses fee-paying households, so it describes dues among payers rather than among every homeowner.
How your fee comparison works
The checker places your entered monthly fee into one of the thirteen published B25142 ranges. It reports the share in lower ranges and the share in your range or lower. It does not interpolate a precise percentile inside a range, and a high position does not prove that your association is overcharging. A $0 input falls into the under-$25 range; it does not describe the separate no-required-fee population.
Mortgage status, coverage and uncertainty
State details also report the fee medians with and without a mortgage. Differences describe different groups of homes, not a fee discount caused by having a mortgage. The expanded HOA/condo question began in 2024, so pre-2024 condo-only data is not used for a fee trend. Published median margins of error are shown at 90% confidence. Derived-share uncertainty is unavailable; ranks use point estimates and shared ranks for exact ties.
Source and reproducibility
U.S. Census Bureau · ACS 2024 1-year. Sources retrieved October 1, 2026. The snapshot stays fixed until a reviewed data refresh; this page does not claim live data.
Archived source files, selection rules and SHA-256 checksums.
Common questions
Is $500 a high HOA fee?
Select your state and enter $500 to inspect its published fee distribution. Services and property types differ, so the result is context rather than a verdict.
Are these management-company fees?
No. They are required dues reported by homeowners, not management charges per unit or special-assessment estimates.