U.S. Census Bureau · Manufactured Housing Survey
Manufactured Home Prices by State
Compare the published price of new manufactured homes, by size and state.
2014–2025 annual averages · home price only · suppressed estimates remain unavailable
Explore every state ↓2025 · All sizes · nominal dollars
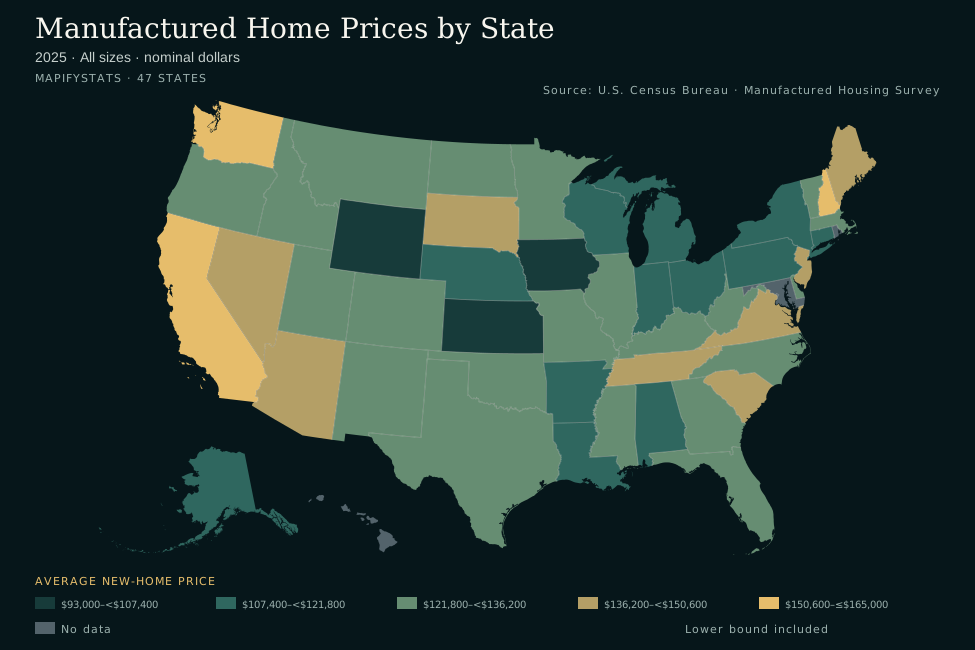
- $93,000–<$107,400
- $107,400–<$121,800
- $121,800–<$136,200
- $136,200–<$150,600
- $150,600–≤$165,000
- No data
- Lower bound included
State estimates and source notes are available below. Enable JavaScript for interactive comparisons.
Compare two states
Historical comparison
Scroll the chart horizontally to see the full period →
View chart values as a table
All 50 states and DC
California has the highest selected point estimate ($164,800); Kansas has the lowest ($93,000).
2025 · All sizes · nominal dollars
Scroll horizontally to see every column →
| Alabama | $115,900 | 3.3% | 3.5% | 36 |
|---|---|---|---|---|
| Alaska | $118,900 | 48.3% | 18.2% | 33 |
| Arizona | $142,600 | 2.1% | 2.7% | 7 |
| Arkansas | $115,200 | 16.1% | 5.6% | 38 |
| California | $164,800 | -1.3% | 3.2% | 1 |
| Colorado | $127,100 | 11.3% | 5.2% | 25 |
| Connecticut | $110,400 | -9.7% | 8.3% | 40 |
| Delaware | $132,000 | 7.4% | 12.0% | 17 |
| District of Columbia | Unavailable | Unavailable | Unavailable | Unranked |
| Florida | $133,500 | -1.2% | 2.9% | 14 |
| Georgia | $131,300 | 5.2% | 3.6% | 18 |
| Hawaii | Unavailable | Unavailable | Unavailable | Unavailable |
| Idaho | $125,300 | -11.9% | 6.7% | 26 |
| Illinois | $124,600 | 9.3% | 4.1% | 28 |
| Indiana | $110,400 | 7.6% | 3.7% | 40 |
| Iowa | $100,600 | -4.6% | 5.4% | 45 |
| Kansas | $93,000 | -9.2% | 6.0% | 47 |
| Kentucky | $125,200 | 11.7% | 4.1% | 27 |
| Louisiana | $109,100 | 10.3% | 3.7% | 42 |
| Maine | $140,200 | 3.9% | 4.4% | 10 |
| Maryland | Unavailable | Unavailable | Unavailable | Unavailable |
| Massachusetts | $133,700 | 10.8% | 15.5% | 13 |
| Michigan | $107,800 | -7.1% | 2.2% | 43 |
| Minnesota | $123,400 | -5.1% | 4.3% | 30 |
| Mississippi | $130,300 | 7.2% | 4.1% | 20 |
| Missouri | $122,900 | 2.4% | 3.0% | 32 |
| Montana | $133,200 | 4.5% | 8.5% | 15 |
| Nebraska | $111,500 | 6.8% | 6.9% | 39 |
| Nevada | $150,500 | 15.9% | 5.6% | 4 |
| New Hampshire | $154,500 | 20.2% | 7.9% | 3 |
| New Jersey | $147,200 | 8.3% | 8.6% | 5 |
| New Mexico | $134,300 | 1.1% | 3.5% | 12 |
| New York | $117,600 | -2.7% | 2.6% | 34 |
| North Carolina | $127,300 | 1.7% | 3.3% | 24 |
| North Dakota | $127,900 | -12.3% | 7.3% | 23 |
| Ohio | $107,800 | 3.8% | 2.5% | 43 |
| Oklahoma | $130,500 | 7.1% | 5.0% | 19 |
| Oregon | $132,100 | -5.2% | 3.8% | 16 |
| Pennsylvania | $116,900 | -1.2% | 2.9% | 35 |
| Rhode Island | Unavailable | Unavailable | Unavailable | Unavailable |
| South Carolina | $141,000 | 3.1% | 3.3% | 9 |
| South Dakota | $141,600 | 4.1% | 5.0% | 8 |
| Tennessee | $138,200 | 6.1% | 3.8% | 11 |
| Texas | $124,500 | 1.6% | 1.8% | 29 |
| Utah | $128,100 | -11.5% | 9.6% | 21 |
| Vermont | $123,200 | -17.3% | 6.3% | 31 |
| Virginia | $143,700 | 16.9% | 8.0% | 6 |
| Washington | $161,600 | 6.7% | 3.1% | 2 |
| West Virginia | $128,000 | 0.8% | 6.4% | 22 |
| Wisconsin | $115,300 | 7.9% | 3.4% | 37 |
| Wyoming | $94,400 | -12.0% | 10.8% | 46 |
Download every source observation as CSV ↓ · Explorer data (JSON)
Single-section, double-section and all sizes
The Census Manufactured Housing Survey publishes annual average sales prices of new manufactured homes sold or intended for residential sale. Single-section and double-section correspond to the common single-wide and double-wide searches. All sizes includes homes with more than two sections; it is not the simple average of the two size categories. Select a size before comparing states.
What the price covers
These are home-only sales prices, not an installed project budget. Land and site-development costs are excluded. Delivery, setup and other site expenses depend on the contract and property. A dealer quote and local site-cost estimates are needed for a buying decision. These prices do not describe used mobile-home values, rents, modular site-built homes or individual listings.
Prices and annual changes
The map uses the published nominal dollar average. Price change = (selected year price ÷ previous year price − 1) × 100. The comparison is unavailable when either observation is suppressed or missing, or when the previous year lies outside the 2014–2025 snapshot. Different mixes of homes and dealers can change an average even without a uniform price increase.
Suppression and sampling uncertainty
D means Census suppressed an estimate to protect dealer or home confidentiality. X means an estimate is not applicable or unavailable. Both stay unavailable in maps and downloads; neither becomes zero. The published relative standard error (RSE) is shown for the selected price. RSE is the standard error as a percentage of the estimate, not a confidence interval. Derived change uncertainty is unavailable; state ranks do not establish statistically significant differences.
Source and reproducibility
U.S. Census Bureau · Manufactured Housing Survey. Sources retrieved October 1, 2026. The snapshot stays fixed until a reviewed data refresh; this page does not claim live data.
Archived source files, selection rules and SHA-256 checksums.
Common questions
Does the average include land?
No. Treat it as a home-price benchmark and obtain separate land, site and installation estimates.
Why is my state missing for some sizes?
Census can suppress small-market estimates or report them as unavailable. Change the size or year to inspect published observations.