U.S. Census Bureau · ACS 2024 1-year
Cost of Owning a Paid-Off Home by State
A paid-off house still has bills. Compare the costs homeowners report after the mortgage is gone.
2024 ACS 1-year · selected owner costs · maintenance is an optional personal allowance
Explore every state ↓2024 · ACS 1-year estimates
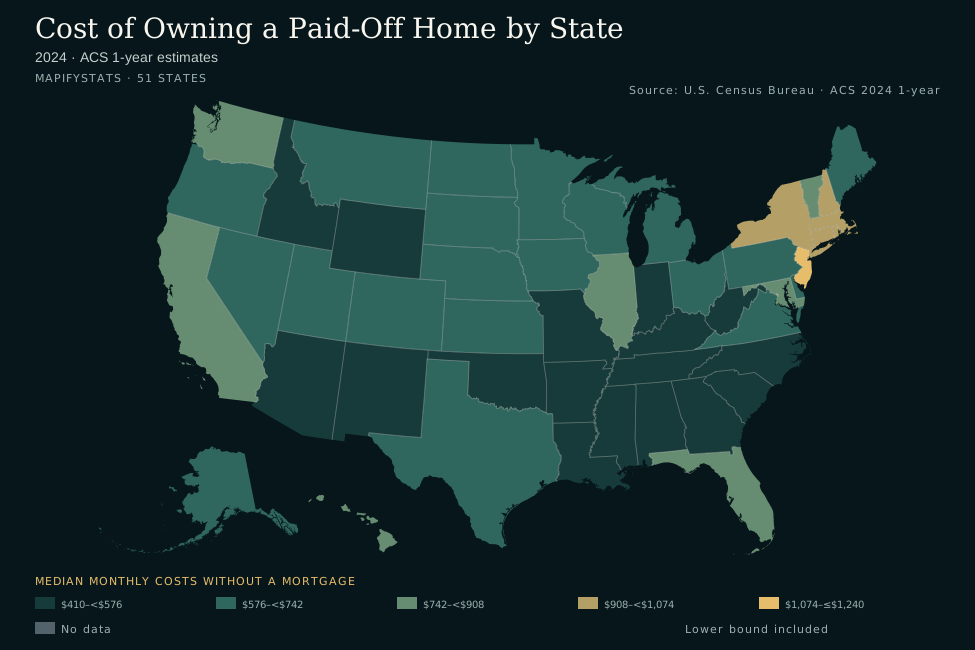
- $410–<$576
- $576–<$742
- $742–<$908
- $908–<$1,074
- $1,074–≤$1,240
- No data
- Lower bound included
State estimates and source notes are available below. Enable JavaScript for interactive comparisons.
Compare two states
Check your paid-off-home budget
Use your monthly taxes, insurance, utilities, fuels and required association or mobile-home fees. Enter annual bills divided by 12.
Enter your bills to compare with the first selected state.
The Census benchmark excludes routine maintenance and repairs. Your allowance is added only to your personal budget. Entries stay in this page and are not included in shared URLs.
Historical comparison
Scroll the chart horizontally to see the full period →
View chart values as a table
All 50 states and DC
New Jersey has the highest selected point estimate ($1,236); West Virginia has the lowest ($412).
2024 · ACS 1-year estimates
Scroll horizontally to see every column →
| Alabama | $469 | $5,628 | ±$5 | $1,500 | 45 |
|---|---|---|---|---|---|
| Alaska | $698 | $8,376 | ±$22 | $2,253 | 19 |
| Arizona | $560 | $6,720 | ±$7 | $1,893 | 37 |
| Arkansas | $450 | $5,400 | ±$6 | $1,375 | 47 |
| California | $882 | $10,584 | ±$6 | $3,001 | 7 |
| Colorado | $722 | $8,664 | ±$10 | $2,466 | 14 |
| Connecticut | $1,060 | $12,720 | ±$12 | $2,454 | 3 |
| Delaware | $596 | $7,152 | ±$21 | $1,821 | 31 |
| District of Columbia | $958 | $11,496 | ±$72 | $3,181 | Unranked |
| Florida | $766 | $9,192 | ±$5 | $2,168 | 12 |
| Georgia | $575 | $6,900 | ±$5 | $1,909 | 34 |
| Hawaii | $760 | $9,120 | ±$27 | $2,937 | 13 |
| Idaho | $500 | $6,000 | ±$10 | $1,769 | 41 |
| Illinois | $807 | $9,684 | ±$6 | $1,994 | 9 |
| Indiana | $526 | $6,312 | ±$6 | $1,466 | 39 |
| Iowa | $615 | $7,380 | ±$8 | $1,538 | 27 |
| Kansas | $656 | $7,872 | ±$8 | $1,749 | 21 |
| Kentucky | $470 | $5,640 | ±$6 | $1,453 | 44 |
| Louisiana | $471 | $5,652 | ±$7 | $1,650 | 43 |
| Maine | $657 | $7,884 | ±$12 | $1,796 | 20 |
| Maryland | $790 | $9,480 | ±$10 | $2,389 | 11 |
| Massachusetts | $1,069 | $12,828 | ±$10 | $2,755 | 2 |
| Michigan | $598 | $7,176 | ±$4 | $1,573 | 29 |
| Minnesota | $717 | $8,604 | ±$6 | $1,985 | 15 |
| Mississippi | $449 | $5,388 | ±$7 | $1,448 | 49 |
| Missouri | $564 | $6,768 | ±$5 | $1,589 | 36 |
| Montana | $589 | $7,068 | ±$14 | $1,878 | 32 |
| Nebraska | $700 | $8,400 | ±$11 | $1,764 | 18 |
| Nevada | $634 | $7,608 | ±$12 | $2,008 | 24 |
| New Hampshire | $1,002 | $12,024 | ±$20 | $2,399 | 4 |
| New Jersey | $1,236 | $14,832 | ±$9 | $2,797 | 1 |
| New Mexico | $450 | $5,400 | ±$9 | $1,628 | 47 |
| New York | $980 | $11,760 | ±$10 | $2,544 | 5 |
| North Carolina | $524 | $6,288 | ±$5 | $1,747 | 40 |
| North Dakota | $576 | $6,912 | ±$15 | $1,814 | 33 |
| Ohio | $610 | $7,320 | ±$5 | $1,563 | 28 |
| Oklahoma | $535 | $6,420 | ±$6 | $1,606 | 38 |
| Oregon | $713 | $8,556 | ±$10 | $2,234 | 16 |
| Pennsylvania | $639 | $7,668 | ±$5 | $1,775 | 23 |
| Rhode Island | $926 | $11,112 | ±$25 | $2,262 | 6 |
| South Carolina | $476 | $5,712 | ±$6 | $1,627 | 42 |
| South Dakota | $628 | $7,536 | ±$11 | $1,739 | 25 |
| Tennessee | $468 | $5,616 | ±$5 | $1,637 | 46 |
| Texas | $703 | $8,436 | ±$6 | $2,211 | 17 |
| Utah | $598 | $7,176 | ±$8 | $2,143 | 29 |
| Vermont | $827 | $9,924 | ±$23 | $1,893 | 8 |
| Virginia | $621 | $7,452 | ±$8 | $2,149 | 26 |
| Washington | $805 | $9,660 | ±$8 | $2,519 | 10 |
| West Virginia | $412 | $4,944 | ±$7 | $1,272 | 50 |
| Wisconsin | $644 | $7,728 | ±$5 | $1,701 | 22 |
| Wyoming | $575 | $6,900 | ±$18 | $1,815 | 34 |
Download every source observation as CSV ↓ · Explorer data (JSON)
What a paid-off home still costs
The median selected monthly owner costs for housing units without a mortgage come from ACS 2024 1-year table B25088. They include real estate taxes, fire/hazard/flood insurance, utilities and fuels, and applicable required HOA, condo and mobile-home costs. Routine repairs, maintenance, major replacements and the opportunity cost of home equity are not included. This is a surveyed statewide midpoint, not a quote for a specific property.
Monthly and annual budgeting
Annualized costs multiply the published monthly median by 12. This is an annualized monthly benchmark, not a separately surveyed median annual expense. The personal budget checker compares your selected bills with the monthly median and then adds only the maintenance allowance you enter to your own budget. It does not assume every home needs the same repair allowance.
Compare mortgage status carefully
The chart shows monthly costs for homes with and without a mortgage in the two selected states. These are different groups of homes and homeowners. Subtracting the medians does not estimate what a particular household would save by paying off its loan. Location, housing type, property values and the populations surveyed can differ.
2024 definition and uncertainty
Beginning in 2024, ACS selected owner costs include required HOA fees as well as condo fees. Earlier surveys did not include the HOA component, so this explorer presents a 2024 snapshot instead of drawing a misleading historical trend. Published monthly-median margins of error are shown at 90% confidence. Annualized uncertainty would be the monthly margin multiplied by 12. Small rank differences are not significance tests.
Source and reproducibility
U.S. Census Bureau · ACS 2024 1-year. Sources retrieved October 1, 2026. The snapshot stays fixed until a reviewed data refresh; this page does not claim live data.
Archived source files, selection rules and SHA-256 checksums.
Common questions
Can I live mortgage-free with no housing expenses?
Real estate taxes, insurance, utilities and applicable fees remain. Maintenance and major repairs can add expenses beyond this Census benchmark.
Is this a retirement cost-of-living index?
No. It covers selected housing expenses only, not food, transport, healthcare or other retirement expenses.