U.S. Census Bureau · ACS 1-year
Rent Growth vs Renter Income by State
Where have rents risen faster than renter incomes? Compare the changes on the same time and price basis.
ACS 1-year estimates · 2019 and 2021–2024 · no standard 2020 estimate
Explore every state ↓2019–2024 · nominal growth
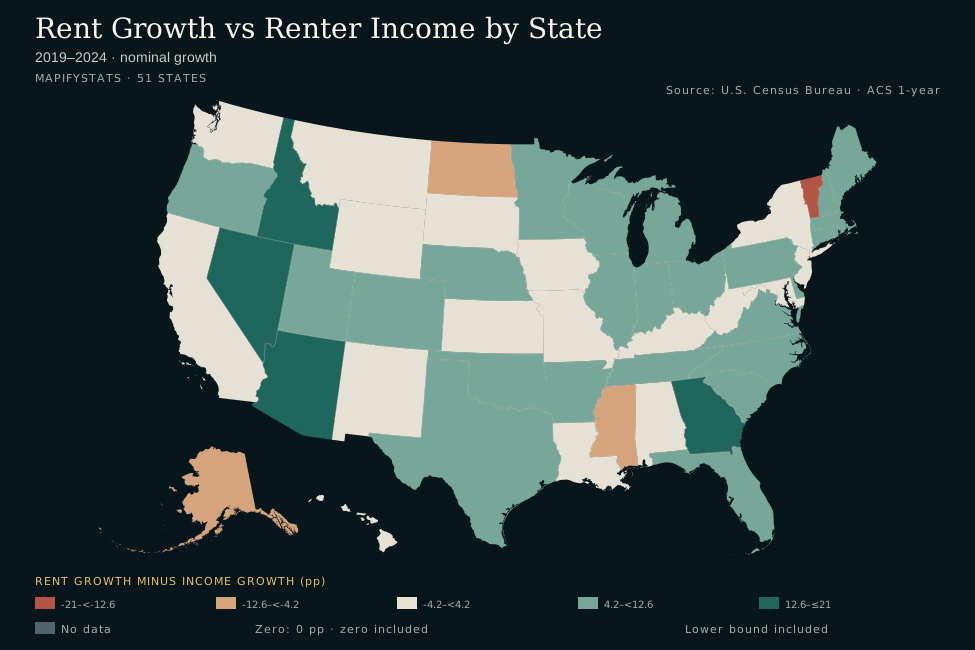
- -21–<-12.6
- -12.6–<-4.2
- -4.2–<4.2
- 4.2–<12.6
- 12.6–≤21
- No data
- Lower bound included
- Zero: 0 pp · zero included
State estimates and source notes are available below. Enable JavaScript for interactive comparisons.
Compare two states
Historical comparison
Scroll the chart horizontally to see the full period →
View chart values as a table
All 50 states and DC
Nevada has the highest selected point estimate (20.7 pp); Vermont has the lowest (-17.1 pp).
2019–2024 · nominal growth
Scroll horizontally to see every column →
| Alabama | -0.6 pp | 33.5% | 34.1% | $807 | $1,077 | $31,130 | $41,737 | 42 |
|---|---|---|---|---|---|---|---|---|
| Alaska | -6.8 pp | 20.2% | 27.1% | $1,201 | $1,444 | $50,288 | $63,891 | 49 |
| Arizona | 15.3 pp | 51.9% | 36.6% | $1,101 | $1,672 | $44,547 | $60,839 | 3 |
| Arkansas | 4.9 pp | 32.3% | 27.5% | $742 | $982 | $31,931 | $40,708 | 23 |
| California | 3.7 pp | 30.4% | 26.7% | $1,614 | $2,104 | $56,975 | $72,161 | 31 |
| Colorado | 7.5 pp | 33.1% | 25.6% | $1,369 | $1,822 | $52,362 | $65,761 | 15 |
| Connecticut | 8.0 pp | 31.7% | 23.7% | $1,177 | $1,550 | $42,571 | $52,652 | 13 |
| Delaware | 4.4 pp | 37.1% | 32.7% | $1,116 | $1,530 | $43,804 | $58,145 | 28 |
| District of Columbia | 2.1 pp | 20.5% | 18.3% | $1,603 | $1,931 | $63,744 | $75,427 | Unranked |
| Florida | 12.5 pp | 46.4% | 33.9% | $1,238 | $1,812 | $42,171 | $56,455 | 5 |
| Georgia | 14.5 pp | 43.6% | 29.1% | $1,049 | $1,506 | $40,560 | $52,364 | 4 |
| Hawaii | 2.7 pp | 17.6% | 15.0% | $1,651 | $1,942 | $60,844 | $69,950 | 35 |
| Idaho | 15.4 pp | 57.3% | 41.9% | $880 | $1,384 | $38,029 | $53,955 | 2 |
| Illinois | 5.2 pp | 29.6% | 24.4% | $1,020 | $1,322 | $40,853 | $50,810 | 22 |
| Indiana | 4.3 pp | 31.4% | 27.1% | $840 | $1,104 | $34,263 | $43,560 | 29 |
| Iowa | -0.0 pp | 21.4% | 21.4% | $808 | $981 | $36,140 | $43,886 | 41 |
| Kansas | 0.1 pp | 25.2% | 25.1% | $862 | $1,079 | $38,225 | $47,816 | 40 |
| Kentucky | 1.4 pp | 29.1% | 27.7% | $773 | $998 | $32,318 | $41,257 | 37 |
| Louisiana | -3.5 pp | 22.9% | 26.3% | $866 | $1,064 | $29,182 | $36,862 | 46 |
| Maine | 8.3 pp | 39.1% | 30.8% | $870 | $1,210 | $35,103 | $45,912 | 12 |
| Maryland | 2.8 pp | 22.8% | 20.1% | $1,401 | $1,721 | $51,918 | $62,329 | 33 |
| Massachusetts | 6.1 pp | 35.9% | 29.7% | $1,360 | $1,848 | $49,021 | $63,603 | 18 |
| Michigan | 7.1 pp | 31.5% | 24.4% | $888 | $1,168 | $34,722 | $43,209 | 17 |
| Minnesota | 4.4 pp | 27.1% | 22.7% | $1,016 | $1,291 | $42,151 | $51,712 | 27 |
| Mississippi | -6.7 pp | 27.4% | 34.1% | $777 | $990 | $27,899 | $37,417 | 48 |
| Missouri | 1.1 pp | 27.9% | 26.8% | $834 | $1,067 | $35,495 | $45,023 | 38 |
| Montana | -2.8 pp | 41.6% | 44.4% | $831 | $1,177 | $36,812 | $53,174 | 45 |
| Nebraska | 6.0 pp | 28.3% | 22.3% | $859 | $1,102 | $39,920 | $48,834 | 19 |
| Nevada | 20.7 pp | 46.3% | 25.7% | $1,168 | $1,709 | $45,541 | $57,223 | 1 |
| New Hampshire | 5.6 pp | 35.8% | 30.2% | $1,147 | $1,558 | $45,095 | $58,715 | 20 |
| New Jersey | 3.9 pp | 30.8% | 26.9% | $1,376 | $1,800 | $51,946 | $65,930 | 30 |
| New Mexico | -0.7 pp | 31.9% | 32.6% | $847 | $1,117 | $34,367 | $45,564 | 43 |
| New York | 3.2 pp | 24.8% | 21.7% | $1,309 | $1,634 | $48,059 | $58,468 | 32 |
| North Carolina | 11.7 pp | 43.7% | 32.0% | $931 | $1,338 | $37,784 | $49,875 | 7 |
| North Dakota | -5.4 pp | 21.9% | 27.3% | $804 | $980 | $39,094 | $49,766 | 47 |
| Ohio | 8.3 pp | 34.1% | 25.7% | $813 | $1,090 | $34,624 | $43,537 | 11 |
| Oklahoma | 4.8 pp | 28.3% | 23.4% | $814 | $1,044 | $35,624 | $43,972 | 24 |
| Oregon | 7.1 pp | 34.8% | 27.6% | $1,185 | $1,597 | $45,049 | $57,498 | 16 |
| Pennsylvania | 4.7 pp | 31.7% | 27.0% | $951 | $1,252 | $37,761 | $47,941 | 25 |
| Rhode Island | 4.6 pp | 36.0% | 31.3% | $1,043 | $1,418 | $37,333 | $49,031 | 26 |
| South Carolina | 11.0 pp | 38.0% | 26.9% | $922 | $1,272 | $36,198 | $45,948 | 8 |
| South Dakota | 2.7 pp | 29.9% | 27.2% | $769 | $999 | $36,467 | $46,380 | 34 |
| Tennessee | 7.5 pp | 42.0% | 34.5% | $904 | $1,284 | $36,565 | $49,183 | 14 |
| Texas | 10.4 pp | 35.2% | 24.8% | $1,091 | $1,475 | $43,583 | $54,387 | 9 |
| Utah | 11.8 pp | 45.1% | 33.3% | $1,098 | $1,593 | $47,681 | $63,564 | 6 |
| Vermont | -17.1 pp | 34.6% | 51.7% | $980 | $1,319 | $35,354 | $53,641 | 50 |
| Virginia | 8.6 pp | 31.3% | 22.6% | $1,254 | $1,646 | $49,943 | $61,242 | 10 |
| Washington | 2.6 pp | 34.2% | 31.6% | $1,359 | $1,824 | $52,334 | $68,871 | 36 |
| West Virginia | -2.3 pp | 21.5% | 23.8% | $727 | $883 | $26,967 | $33,383 | 44 |
| Wisconsin | 5.5 pp | 31.7% | 26.2% | $867 | $1,142 | $39,184 | $49,446 | 21 |
| Wyoming | 0.8 pp | 21.4% | 20.6% | $822 | $998 | $38,207 | $46,071 | 39 |
Download every source observation as CSV ↓ · Explorer data (JSON)
Where rent is gaining on income
The gap compares growth in median gross rent with growth in median renter-household income. A positive gap means rent grew faster over the selected period; a negative gap means renter income grew faster. This is a comparison of two statewide medians, not a measurement of any particular household's rent burden or pay raise. Changes in the households and homes sampled can also change the medians.
Compare renters with renters
Gross rent comes from ACS B25064 and includes contract rent plus applicable utilities and fuels paid separately. Its universe is renter-occupied housing units paying cash rent. Income comes from the renter-occupied category in ACS B25119, covering renter households. These related universes are not identical; no ratio of these medians is labeled as an observed household burden. Income is annual and gross rent is monthly, while the growth comparison is dimensionless.
Nominal and inflation-adjusted growth
Nominal growth = (ending value ÷ starting value − 1) × 100. CPI-adjusted growth = (ending value ÷ starting value ÷ CPI factor − 1) × 100. The CPI factor is the ending annual-average national CPI-U divided by the starting annual average; each average is calculated from the twelve published monthly levels. This controls for general national inflation, not state-specific price changes. The gap is rent growth minus income growth, in percentage points.
Source years and uncertainty
This release uses standard ACS 1-year estimates for 2019 and 2021–2024. No standard 2020 1-year estimate is inserted or interpolated. Source-dollar medians and their published 90% margins of error remain visible in the state comparison. Derived growth and gap margins of error are unavailable, so differences in rank are descriptive rather than significance tests. ACS income is expressed in each survey year's dollars; the real-growth option puts the changes on a common price basis.
Source and reproducibility
U.S. Census Bureau · ACS 1-year. Sources retrieved October 1, 2026. BLS CPI-U monthly levels supply the national inflation adjustment. The snapshot stays fixed until a reviewed data refresh; this page does not claim live data.
Archived source files, selection rules and SHA-256 checksums.
Common questions
Is this asking rent for a new lease?
No. ACS gross rent describes surveyed occupied cash-rent homes, including long-standing tenancies; it is not a listing-price index.
Does a positive gap prove every renter became worse off?
No. These are repeated cross-sectional medians, not the same households followed over time.