U.S. Census Bureau · ACS 2024 1-year
Housing Age by State
Explore where the housing stock is oldest, and which construction eras make up each state's homes.
2024 ACS 1-year estimates · all housing units
Explore every state ↓2024 · ACS 1-year
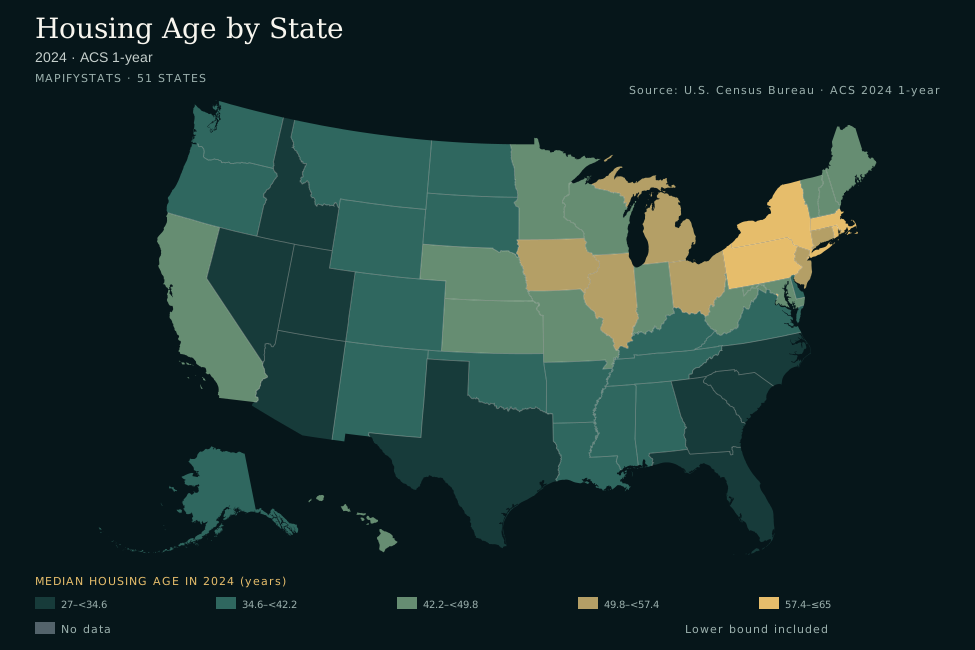
- 27–<34.6
- 34.6–<42.2
- 42.2–<49.8
- 49.8–<57.4
- 57.4–≤65
- No data
- Lower bound included
State estimates and source notes are available below. Enable JavaScript for interactive comparisons.
Compare two states
Construction eras
Scroll the chart horizontally to see the full period →
View chart values as a table
All 50 states and DC
New York has the highest selected point estimate (65 years); Nevada has the lowest (27 years).
2024 · ACS 1-year
Scroll horizontally to see every column →
| Alabama | 37 years | 4.6% | 41.0% | 15.7% | 1,987 | 2,381,771 | 35 |
|---|---|---|---|---|---|---|---|
| Alaska | 38 years | 1.3% | 36.7% | 11.8% | 1,986 | 329,757 | 34 |
| Arizona | 30 years | 1.4% | 27.9% | 17.9% | 1,994 | 3,299,178 | 47 |
| Arkansas | 35 years | 3.8% | 38.0% | 17.0% | 1,989 | 1,421,029 | 40 |
| California | 47 years | 8.8% | 54.8% | 9.5% | 1,977 | 14,877,017 | 14 |
| Colorado | 35 years | 6.6% | 37.8% | 19.4% | 1,989 | 2,662,111 | 40 |
| Connecticut | 57 years | 20.5% | 67.3% | 5.8% | 1,967 | 1,554,057 | 5 |
| Delaware | 36 years | 8.1% | 40.9% | 18.7% | 1,988 | 476,415 | 38 |
| District of Columbia | 64 years | 31.0% | 66.3% | 20.6% | 1,960 | 368,700 | Unranked |
| Florida | 34 years | 1.8% | 32.0% | 17.8% | 1,990 | 10,629,845 | 42 |
| Georgia | 31 years | 3.9% | 30.3% | 17.6% | 1,993 | 4,668,796 | 43 |
| Hawaii | 43 years | 2.9% | 48.8% | 11.9% | 1,981 | 572,824 | 23 |
| Idaho | 31 years | 6.9% | 36.4% | 21.4% | 1,993 | 832,052 | 43 |
| Illinois | 53 years | 20.0% | 62.2% | 6.8% | 1,971 | 5,482,133 | 6 |
| Indiana | 47 years | 15.8% | 53.3% | 11.8% | 1,977 | 3,026,101 | 14 |
| Iowa | 51 years | 22.4% | 59.6% | 12.6% | 1,973 | 1,458,471 | 10 |
| Kansas | 48 years | 15.5% | 54.8% | 10.8% | 1,976 | 1,310,001 | 11 |
| Kentucky | 41 years | 8.9% | 46.1% | 13.1% | 1,983 | 2,051,004 | 27 |
| Louisiana | 41 years | 5.6% | 45.5% | 15.7% | 1,983 | 2,138,882 | 27 |
| Maine | 46 years | 22.4% | 52.5% | 9.9% | 1,978 | 764,713 | 18 |
| Maryland | 44 years | 10.3% | 50.4% | 11.0% | 1,980 | 2,588,337 | 21 |
| Massachusetts | 59 years | 30.2% | 66.2% | 8.6% | 1,965 | 3,057,853 | 3 |
| Michigan | 52 years | 14.5% | 61.4% | 7.1% | 1,972 | 4,669,109 | 9 |
| Minnesota | 45 years | 15.3% | 51.3% | 12.9% | 1,979 | 2,597,229 | 20 |
| Mississippi | 37 years | 3.7% | 40.1% | 14.5% | 1,987 | 1,359,223 | 35 |
| Missouri | 46 years | 13.0% | 52.2% | 11.2% | 1,978 | 2,858,527 | 18 |
| Montana | 41 years | 12.0% | 47.4% | 16.8% | 1,983 | 539,622 | 27 |
| Nebraska | 48 years | 18.4% | 55.8% | 13.6% | 1,976 | 880,521 | 11 |
| Nevada | 27 years | 0.9% | 20.7% | 18.7% | 1,997 | 1,365,893 | 50 |
| New Hampshire | 44 years | 18.2% | 50.6% | 9.5% | 1,980 | 657,198 | 21 |
| New Jersey | 53 years | 17.2% | 61.0% | 8.9% | 1,971 | 3,816,432 | 6 |
| New Mexico | 39 years | 4.4% | 41.6% | 11.3% | 1,985 | 973,944 | 31 |
| New York | 65 years | 30.1% | 73.2% | 7.1% | 1,959 | 8,676,911 | 1 |
| North Carolina | 31 years | 4.7% | 32.5% | 19.7% | 1,993 | 5,073,509 | 43 |
| North Dakota | 39 years | 10.6% | 44.6% | 22.7% | 1,985 | 380,994 | 31 |
| Ohio | 53 years | 18.8% | 62.0% | 8.2% | 1,971 | 5,336,168 | 6 |
| Oklahoma | 42 years | 6.8% | 47.5% | 15.4% | 1,982 | 1,800,427 | 24 |
| Oregon | 42 years | 10.5% | 48.0% | 14.0% | 1,982 | 1,896,851 | 24 |
| Pennsylvania | 58 years | 24.8% | 66.3% | 7.3% | 1,966 | 5,861,320 | 4 |
| Rhode Island | 60 years | 27.3% | 69.1% | 5.7% | 1,964 | 488,011 | 2 |
| South Carolina | 31 years | 3.4% | 31.9% | 22.1% | 1,993 | 2,531,310 | 43 |
| South Dakota | 40 years | 14.1% | 46.7% | 19.1% | 1,984 | 423,705 | 30 |
| Tennessee | 36 years | 5.6% | 38.9% | 18.5% | 1,988 | 3,243,954 | 38 |
| Texas | 30 years | 2.9% | 31.2% | 25.3% | 1,994 | 12,616,736 | 47 |
| Utah | 30 years | 5.8% | 33.1% | 24.5% | 1,994 | 1,283,206 | 47 |
| Vermont | 47 years | 22.0% | 54.9% | 9.2% | 1,977 | 343,166 | 14 |
| Virginia | 39 years | 6.9% | 42.4% | 13.5% | 1,985 | 3,746,211 | 31 |
| Washington | 37 years | 9.3% | 41.5% | 17.2% | 1,987 | 3,400,980 | 35 |
| West Virginia | 47 years | 14.6% | 54.6% | 9.2% | 1,977 | 866,433 | 14 |
| Wisconsin | 48 years | 17.5% | 55.4% | 10.4% | 1,976 | 2,820,538 | 11 |
| Wyoming | 42 years | 10.7% | 47.5% | 12.8% | 1,982 | 281,789 | 24 |
Download every source observation as CSV ↓ · Explorer data (JSON)
Where older housing is concentrated
Median housing age describes the midpoint of the housing-unit construction-year distribution. A state with older housing can have a substantial newer-home market as well. Switch to construction-era shares to see that mix: the share built before 1940, before 1980 or since 2010 can tell a different story from the median.
Construction age is not condition
Year built describes original construction, not the date of a remodel, a new roof or electrical work. Age alone cannot establish maintenance needs, code compliance or the presence of a particular material. The universe is all housing units, including apartments and vacant units; the data do not count only detached houses or count buildings as a single unit.
Methodology and uncertainty
ACS 2024 1-year table B25035 supplies median year structure built; housing age in this explorer is 2024 minus that published median year. It is age at the survey year, not age recalculated to today. B25034 supplies ten construction-era counts, which reconcile to total housing units for every state and DC. Before 1980 includes 1970–1979 and all earlier eras; since 2010 includes 2010–2019 and 2020 or later. Each share uses all housing units as its denominator.
Interpret small differences carefully
The source publishes a 90% margin of error for median construction year, shown in the state details. Derived share margins are unavailable here; the archived source includes individual construction-era count margins. Tied point estimates share a rank. A rank should not be read as proof that one state's underlying housing age differs significantly from another's.
Source and reproducibility
U.S. Census Bureau · ACS 2024 1-year. Sources retrieved October 1, 2026. The snapshot stays fixed until a reviewed data refresh; this page does not claim live data.
Archived source files, selection rules and SHA-256 checksums.
Common questions
Which states have the oldest homes?
Select median housing age and sort the table from highest to lowest. The construction-era views show whether the oldest stock is concentrated in a particular period.
Can this identify an individual home's age?
No. These are state estimates. An individual property's records and inspection answer that question.