Free local comparison · no account needed
Rent Affordability in Hillsborough County, FL
Set your income and bedroom count, then compare places within your housing budget.
FY2027 gross-rent benchmarks · effective October 1, 2026 · utilities included
Explore the map and calculator ↓Loading interactive controls. The saved example and source data are available below.
Saved example: $50,000 annual gross income · 2 bedrooms · 30% rent budget. Change the inputs to calculate your own comparison.
67 points shown; 67 places in this view. Dot colors run from lower teal values to higher rust values; gray means unavailable. Exact values follow in the table.
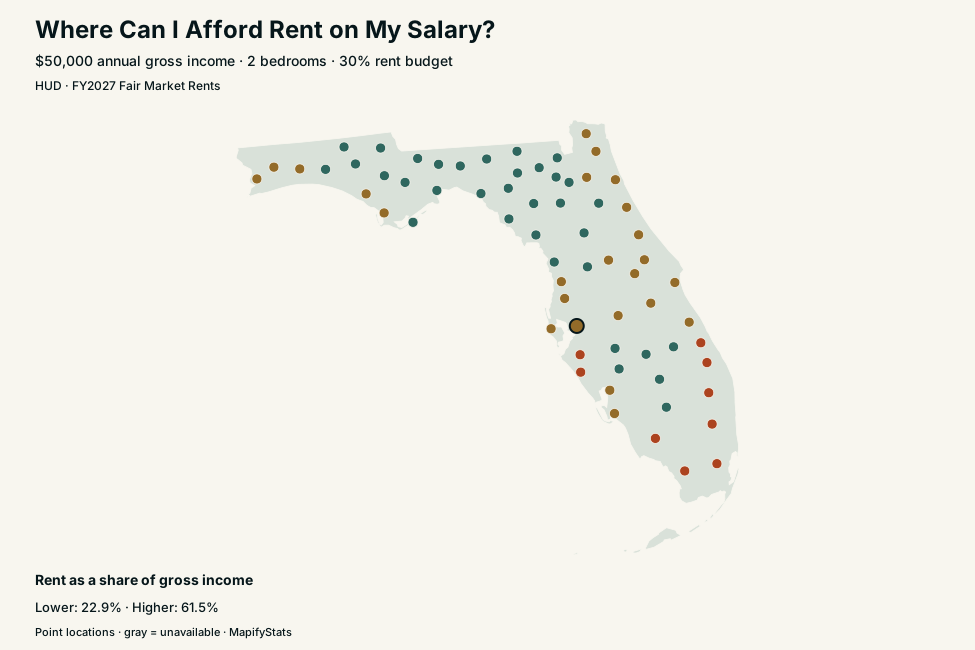
Hillsborough County, FL
$50,000 annual gross income · 2 bedrooms · 30% rent budget
- Monthly gross-rent benchmark
- $1,917
- Share of gross income
- 46.0%
- Annual income needed at 30%
- $76,680
- Within selected rent budget
- No
Your monthly budget is $1,250. Rent includes tenant-paid utilities except telephone, cable and internet; avoid counting included utilities twice. This is a planning benchmark, not a listed apartment.
| Home size | Monthly gross rent | Income needed at your budget | Within budget |
|---|---|---|---|
| Studio | $1,597 | $63,880 | No |
| 1 bedroom | $1,648 | $65,920 | No |
| 2 bedrooms | $1,917 | $76,680 | No |
| 3 bedrooms | $2,448 | $97,920 | No |
| 4 bedrooms | $2,977 | $119,080 | No |
Published HUD county/area benchmark; 1 matched HUD record. Fair Market Rents generally represent the 40th percentile of standard-quality recent-mover rents. Town-level records are population-weighted where a county has more than one HUD area.
Compare places in this state
20 of 67 places shown in the saved example. Interactive controls can search every place in the dataset.
Scroll the table horizontally to see every column →
| Place | Rent as a share of gross income | Monthly rent | Within budget |
|---|---|---|---|
| Alachua County, FL | 35.3% | $1,471 | No |
| Baker County, FL | 26.6% | $1,110 | Yes |
| Bay County, FL | 39.6% | $1,651 | No |
| Bradford County, FL | 24.2% | $1,008 | Yes |
| Brevard County, FL | 42.7% | $1,779 | No |
| Broward County, FL | 55.7% | $2,321 | No |
| Calhoun County, FL | 22.9% | $953 | Yes |
| Charlotte County, FL | 37.8% | $1,575 | No |
| Citrus County, FL | 28.7% | $1,194 | Yes |
| Clay County, FL | 40.7% | $1,694 | No |
| Collier County, FL | 48.9% | $2,036 | No |
| Columbia County, FL | 28.5% | $1,187 | Yes |
| DeSoto County, FL | 26.1% | $1,089 | Yes |
| Dixie County, FL | 25.0% | $1,041 | Yes |
| Duval County, FL | 40.7% | $1,694 | No |
| Escambia County, FL | 37.2% | $1,548 | No |
| Flagler County, FL | 42.2% | $1,758 | No |
| Franklin County, FL | 25.6% | $1,068 | Yes |
| Gadsden County, FL | 34.2% | $1,424 | No |
| Gilchrist County, FL | 35.3% | $1,471 | No |
Find a local guide
Local guides cover fifty of the largest counties by household count, plus Wake and Durham counties. The calculator covers every current U.S. county equivalent.
Browse 51 local guides
Turn salary or hourly pay into a rent budget
Annual income equals the salary entered, or hourly pay multiplied by paid hours per week and paid weeks per year. Rent share equals monthly gross rent times 12 divided by annual gross income. Income needed equals annual benchmark rent divided by your chosen budget percentage. The 30% starting value is an editable planning assumption, not a guarantee of affordability. A zero income has no computable rent percentage.
What the rent benchmark measures
HUD FY2027 Fair Market Rents take effect October 1, 2026. FMR generally describes the 40th percentile of gross rents for standard-quality recent-mover units. Gross rent includes applicable tenant-paid utilities, excluding telephone, cable and internet. It is neither a live listing price nor an average of every available apartment. Multiple town-level records in a county are weighted by HUD's 2024 population field; single county/area records retain the published value. Counties with missing rent or required weights remain unavailable.
Sources and reproducibility
HUD FY2027 Fair Market Rents. Public files retrieved October 1, 2026. These snapshots stay fixed until a reviewed refresh. County points use Census 2024 Gazetteer internal points; metro points are the average of matched county coordinates.
Original download links, archived extract rules and SHA-256 checksums. Missing or suppressed values remain unavailable in maps, tables and downloads. Maps use point locations rather than geographic area to represent counties, metros and stations; dots may overlap at the national scale.
Common questions
Where can I afford rent on $50,000 a year?
Enter $50,000 as an annual salary, choose bedrooms and a budget share, then sort or filter the county table. Within budget means the benchmark fits that selected share of gross income.
Can I compare rent on an hourly wage?
Yes. Select hourly wage and enter paid hours and weeks. The calculator shows the annual conversion and compares the same bedroom count across counties.