Free local comparison · no account needed
Plumber Salary vs Rent in Virginia Beach-Chesapeake-Norfolk, VA-NC
Compare HVAC, plumbing and welding wages with local rent benchmarks.
Median gross wages · constructed rent benchmarks · before taxes and other living costs
Explore the map and calculator ↓Loading interactive controls. The saved example and source data are available below.
Saved example: Plumbers, pipefitters and steamfitters · 2 bedrooms. Change the inputs to calculate your own comparison.
11 points shown; 11 places in this view. Dot colors run from lower teal values to higher rust values; gray means unavailable. Exact values follow in the table.
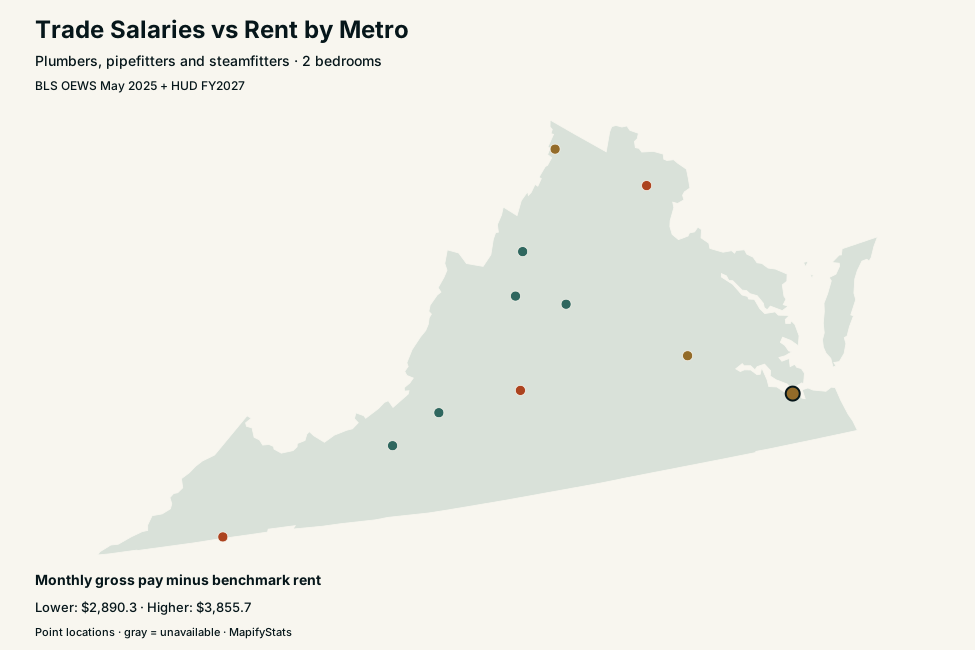
Virginia Beach-Chesapeake-Norfolk, VA-NC
Plumbers, pipefitters and steamfitters · 2 bedrooms
- Median annual gross wage
- $61,870
- Median hourly wage
- $29.75
- Monthly gross pay minus rent
- $3,491
- Rent as a share of median gross pay
- 32.3%
The remainder subtracts the selected rent benchmark from median annual gross pay divided by 12. Taxes, healthcare, transportation, debt and other costs still come out of that amount. It is not take-home pay or a job offer.
| Occupation | Median annual wage | Median hourly wage | Employment | Monthly gross pay minus rent |
|---|---|---|---|---|
| HVAC technicians | $59,470 | $28.59 | 2,840 | $3,291 |
| Plumbers, pipefitters and steamfitters | $61,870 | $29.75 | 5,100 | $3,491 |
| Welders, cutters, solderers and brazers | $62,670 | $30.13 | 3,740 | $3,558 |
ACS renter-household-weighted county HUD benchmarks. 18 of 18 BLS-defined counties matched. $1,665 monthly rent is a constructed metro benchmark, not a published HUD metro figure. Missing wages or incomplete county matching remain unavailable. Wage estimates cover employees; self-employed workers are excluded.
Compare places in this state
11 of 11 places shown in the saved example. Interactive controls can search every place in the dataset.
Scroll the table horizontally to see every column →
| Place | Monthly gross pay minus benchmark rent | Median annual wage | Monthly rent |
|---|---|---|---|
| Blacksburg-Christiansburg-Radford, VA | $3,191.0 | $53,340 | $1,254 |
| Charlottesville, VA | $3,067.2 | $56,510 | $1,642 |
| Harrisonburg, VA | $3,093.5 | $52,290 | $1,264 |
| Kingsport-Bristol, TN-VA | $3,855.7 | $59,360 | $1,091 |
| Lynchburg, VA | $3,650.5 | $57,210 | $1,117 |
| Richmond, VA | $3,474.3 | $61,480 | $1,649 |
| Roanoke, VA | $2,890.3 | $51,700 | $1,418 |
| Staunton-Stuarts Draft, VA | $3,071.8 | $51,250 | $1,199 |
| Virginia Beach-Chesapeake-Norfolk, VA-NC | $3,491.0 | $61,870 | $1,665 |
| Washington-Arlington-Alexandria, DC-VA-MD-WV | $3,565.5 | $71,860 | $2,423 |
| Winchester, VA-WV | $3,308.3 | $57,760 | $1,505 |
Find a local guide
The thirty metros with the largest published employment for this occupation have local guides.
Browse 30 local guides
Compare gross trade pay after benchmark rent
The tool uses median annual and hourly employee wages for HVAC mechanics and installers (49-9021), plumbers, pipefitters and steamfitters (47-2152), and welders, cutters, solderers and brazers (51-4121). Monthly gross pay minus rent equals the published annual median divided by 12, less the selected bedroom rent benchmark. This is an amount before taxes and other expenses, not disposable income. BLS medians describe employees across experience levels, not apprenticeship wages or self-employed business income.
Matching metro wages with county rents
Wages use the May 2025 BLS metro definitions. County HUD FY2027 rents are weighted by 2020–2024 ACS renter-occupied household counts in those same counties. This constructed metro benchmark is not an official HUD metro FMR. All counties must match and have valid rents and renter counts; otherwise the benchmark remains unavailable. Suppressed occupation estimates remain unavailable. The sources describe different periods, so this is a planning comparison rather than a same-year affordability trend or complete cost-of-living index.
Sources and reproducibility
BLS May 2025 Occupational Employment and Wage Statistics and HUD FY2027 FMR with ACS table B25003. Public files retrieved October 1, 2026. These snapshots stay fixed until a reviewed refresh. County points use Census 2024 Gazetteer internal points; metro points are the average of matched county coordinates.
Original download links, archived extract rules and SHA-256 checksums. Missing or suppressed values remain unavailable in maps, tables and downloads. Maps use point locations rather than geographic area to represent counties, metros and stations; dots may overlap at the national scale.
Common questions
Where do HVAC technicians, plumbers or welders earn the most after rent?
Choose an occupation and bedroom count, then sort monthly gross pay minus rent from highest to lowest. Review taxes, other expenses, job availability and source limitations before using the result.
Why is a metro's pay or rent unavailable?
BLS can suppress wage estimates, and county definitions may not completely match the rent snapshot. The tool preserves missing data rather than calculating a partial metro average.