Calculators & maps / Energy
Solar Generation Calculator by City
Explore modeled monthly solar production for a clearly defined system.
PVWatts v8 · NSRDB typical weather · 12 saved city examples · Source snapshot 2026-10-01
Saved example · 12 source places. Interactive controls load automatically.
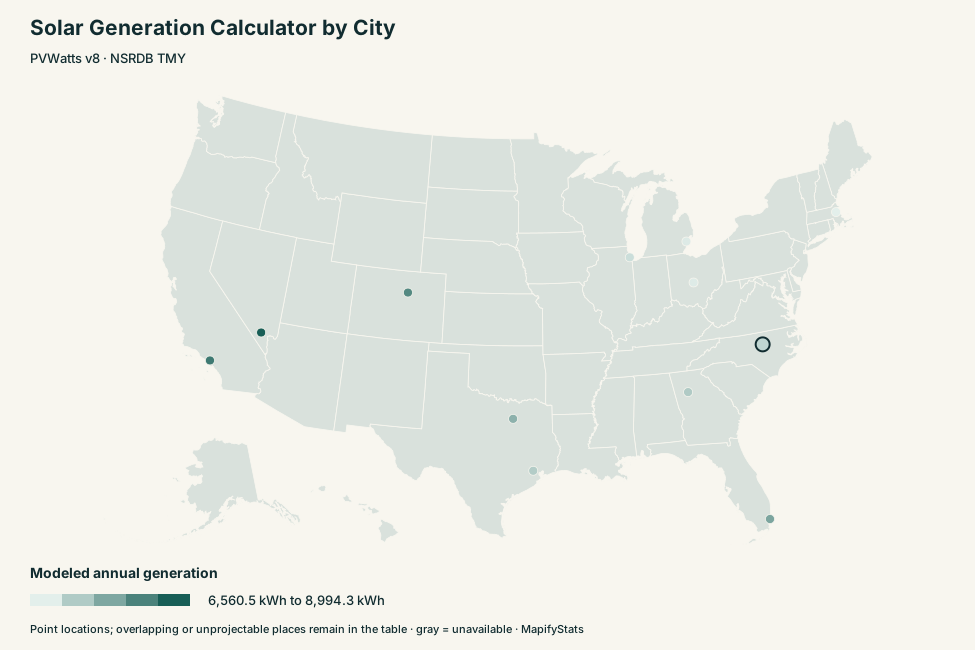
12 plotted places. Exact values and identifiers are available in the table and download.
Selected place
Raleigh city · NC
6,976.2 kWh
Modeled annual generation · PVWatts v8 · NSRDB TMY
Geography identifier: 3755000
- Modeled capacity
- 5 kW
- Annual modeled generation
- 6,976.2 kWh
- December–February generation
- 1,476.6 kWh
- June–August generation
- 1,917.4 kWh
| Month | Modeled AC electricity |
|---|---|
| January | 519.5 kWh |
| February | 495.1 kWh |
| March | 625.9 kWh |
| April | 664.1 kWh |
| May | 644 kWh |
| June | 634 kWh |
| July | 653.7 kWh |
| August | 629.7 kWh |
| September | 608.6 kWh |
| October | 548.4 kWh |
| November | 491.2 kWh |
| December | 462 kWh |
Weather station: · North Carolina; dataset 1096309.csv.
Comparison
Atlanta city · GA
7,174.3 kWh
Modeled annual generation · PVWatts v8 · NSRDB TMY
Geography identifier: 1304000
- Modeled capacity
- 5 kW
- Annual modeled generation
- 7,174.3 kWh
- December–February generation
- 1,489.6 kWh
- June–August generation
- 1,958.3 kWh
| Month | Modeled AC electricity |
|---|---|
| January | 503.4 kWh |
| February | 499.4 kWh |
| March | 603.2 kWh |
| April | 671.4 kWh |
| May | 695.7 kWh |
| June | 637.2 kWh |
| July | 666.8 kWh |
| August | 654.3 kWh |
| September | 602.9 kWh |
| October | 629.2 kWh |
| November | 524 kWh |
| December | 486.9 kWh |
Weather station: · Georgia; dataset 969595.csv.
Compare places
12 source places. Select a place name to inspect its details.
Scroll horizontally to see every column →
1304000 | GA | 7,174.3 kWh | |
2507000 | MA | 6,560.5 kWh | |
1714000 | IL | 6,843 kWh | |
3918000 | OH | 6,625.9 kWh | |
4819000 | TX | 7,596.1 kWh | |
0820000 | CO | 8,272.8 kWh | |
2622000 | MI | 6,636.1 kWh | |
4835000 | TX | 7,141.9 kWh | |
3240000 | NV | 8,994.3 kWh | |
0644000 | CA | 8,537.4 kWh | |
1245000 | FL | 7,800.5 kWh | |
3755000 | NC | 6,976.2 kWh |
How to read this comparison
Saved PVWatts v8 models cover 12 city examples at Census 2024 city internal points: Raleigh, Atlanta, Boston, Chicago, Columbus, Dallas, Denver, Detroit, Houston, Las Vegas, Los Angeles and Miami. Each uses a one-kW DC standard-module roof-mounted array, 30° tilt, south-facing 180° azimuth, 14% losses, DC/AC ratio 1.2 and inverter efficiency 96%.
System size scales the saved monthly and annual one-kW output linearly while retaining those model assumptions. NSRDB typical meteorological-year weather represents a long-term model, not a forecast or an observed production year. Monthly modeled values reconcile to annual output. Actual shading, roof direction, equipment and interannual weather can change production. The station metadata and warnings are retained in downloads. For different tilt, shading or a city outside this saved coverage, use the linked official PVWatts calculator.
Sources and reproducibility
Retrieved 2026-10-01. Original-download and archived-extract SHA-256 checksums and selection rules are preserved in the source manifest. Published missing or suppressed observations remain unavailable.
- pvwatts-0644000.json — Unchanged PVWatts v8 monthly one-kW model fields, except removal of echoed api_key; Census city internal point; standard module, roof mounted, 30-degree tilt, south azimuth, 14% losses, 1.2 DC/AC ratio, 96% inverter efficiency, NSRDB typical meteorological year
- pvwatts-0820000.json — Unchanged PVWatts v8 monthly one-kW model fields, except removal of echoed api_key; Census city internal point; standard module, roof mounted, 30-degree tilt, south azimuth, 14% losses, 1.2 DC/AC ratio, 96% inverter efficiency, NSRDB typical meteorological year
- pvwatts-1245000.json — Unchanged PVWatts v8 monthly one-kW model fields, except removal of echoed api_key; Census city internal point; standard module, roof mounted, 30-degree tilt, south azimuth, 14% losses, 1.2 DC/AC ratio, 96% inverter efficiency, NSRDB typical meteorological year
- pvwatts-1304000.json — Unchanged PVWatts v8 monthly one-kW model fields, except removal of echoed api_key; Census city internal point; standard module, roof mounted, 30-degree tilt, south azimuth, 14% losses, 1.2 DC/AC ratio, 96% inverter efficiency, NSRDB typical meteorological year
- pvwatts-1714000.json — Unchanged PVWatts v8 monthly one-kW model fields, except removal of echoed api_key; Census city internal point; standard module, roof mounted, 30-degree tilt, south azimuth, 14% losses, 1.2 DC/AC ratio, 96% inverter efficiency, NSRDB typical meteorological year
- pvwatts-2507000.json — Unchanged PVWatts v8 monthly one-kW model fields, except removal of echoed api_key; Census city internal point; standard module, roof mounted, 30-degree tilt, south azimuth, 14% losses, 1.2 DC/AC ratio, 96% inverter efficiency, NSRDB typical meteorological year
- pvwatts-2622000.json — Unchanged PVWatts v8 monthly one-kW model fields, except removal of echoed api_key; Census city internal point; standard module, roof mounted, 30-degree tilt, south azimuth, 14% losses, 1.2 DC/AC ratio, 96% inverter efficiency, NSRDB typical meteorological year
- pvwatts-3240000.json — Unchanged PVWatts v8 monthly one-kW model fields, except removal of echoed api_key; Census city internal point; standard module, roof mounted, 30-degree tilt, south azimuth, 14% losses, 1.2 DC/AC ratio, 96% inverter efficiency, NSRDB typical meteorological year
- pvwatts-3755000.json — Unchanged PVWatts v8 monthly one-kW model fields, except removal of echoed api_key; Census city internal point; standard module, roof mounted, 30-degree tilt, south azimuth, 14% losses, 1.2 DC/AC ratio, 96% inverter efficiency, NSRDB typical meteorological year
- pvwatts-3918000.json — Unchanged PVWatts v8 monthly one-kW model fields, except removal of echoed api_key; Census city internal point; standard module, roof mounted, 30-degree tilt, south azimuth, 14% losses, 1.2 DC/AC ratio, 96% inverter efficiency, NSRDB typical meteorological year
- pvwatts-4819000.json — Unchanged PVWatts v8 monthly one-kW model fields, except removal of echoed api_key; Census city internal point; standard module, roof mounted, 30-degree tilt, south azimuth, 14% losses, 1.2 DC/AC ratio, 96% inverter efficiency, NSRDB typical meteorological year
- pvwatts-4835000.json — Unchanged PVWatts v8 monthly one-kW model fields, except removal of echoed api_key; Census city internal point; standard module, roof mounted, 30-degree tilt, south azimuth, 14% losses, 1.2 DC/AC ratio, 96% inverter efficiency, NSRDB typical meteorological year
- solar-city-points.csv — Unchanged Census 2024 place identifiers, names and internal-point coordinates for the 12 modeled city examples
Download the complete source snapshot · Download the saved example comparison