Census Building Permits Survey · Final 2025
2–4-Unit Housing Permits by State, 2025
Where are housing units in small multifamily buildings being authorized? Compare all 50 states and DC by volume, share, or population.
55,741 units · 3.89% of U.S. authorizations
These counts measure housing units authorized in buildings with 2, 3 or 4 units. Authorizations are not completed homes; this category covers only part of missing-middle housing.
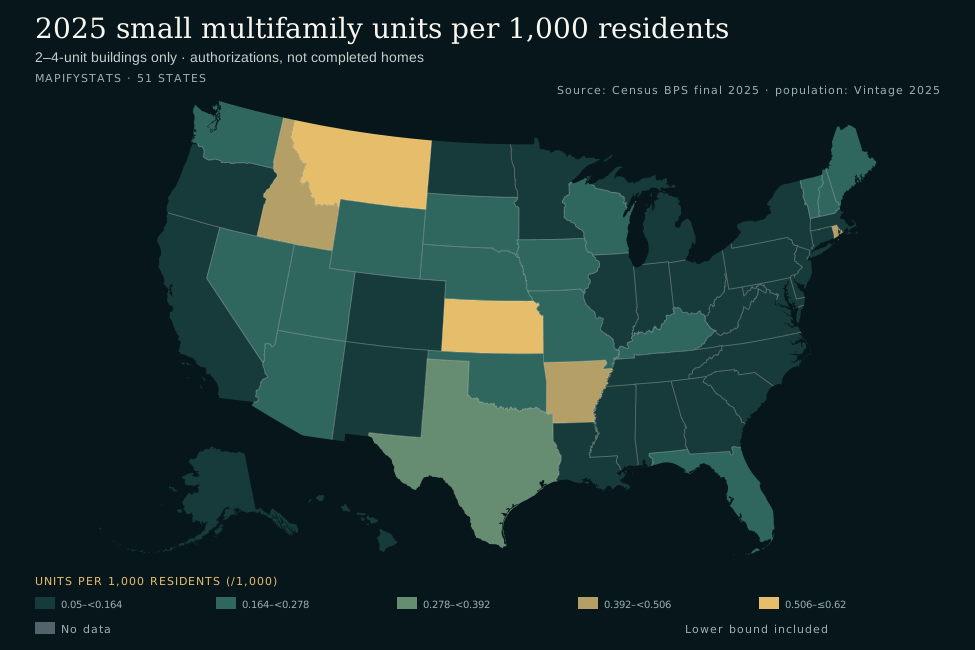
Units per 1,000 residents
Compare authorizations relative to population. Montana leads at 0.612 units per 1,000 residents, about 61 per 100,000.
- 0.05–<0.164
- 0.164–<0.278
- 0.278–<0.392
- 0.392–<0.506
- 0.506–≤0.62
- No data
- Lower bound included
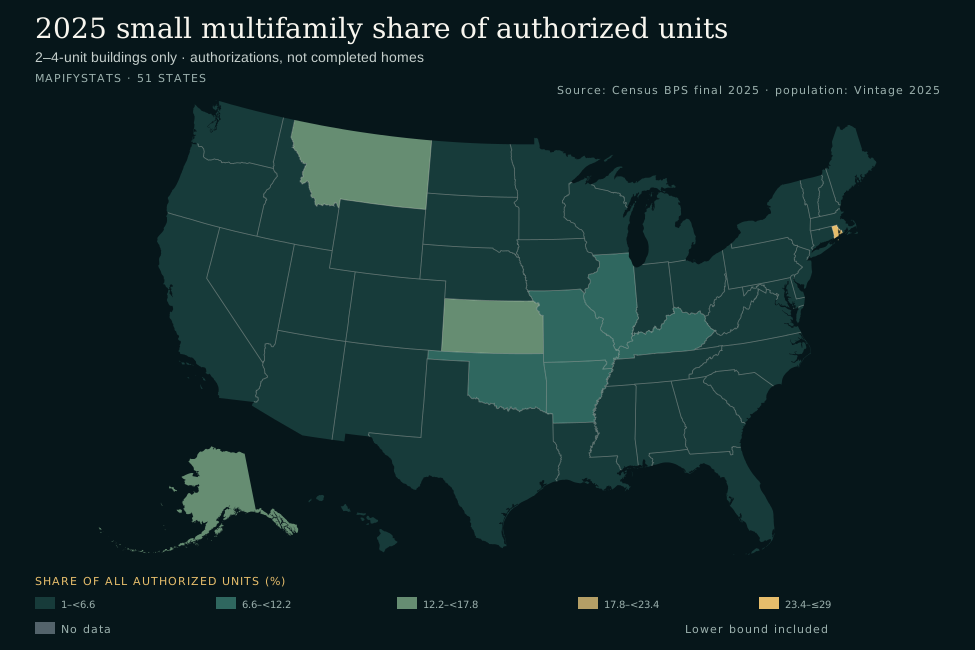
Share of all authorized units
Compare the share of each state's authorizations in 2–4-unit buildings. Rhode Island leads at 28.65%; a high share can coexist with low overall permitting.
- 1–<6.6
- 6.6–<12.2
- 12.2–<17.8
- 17.8–<23.4
- 23.4–≤29
- No data
- Lower bound included
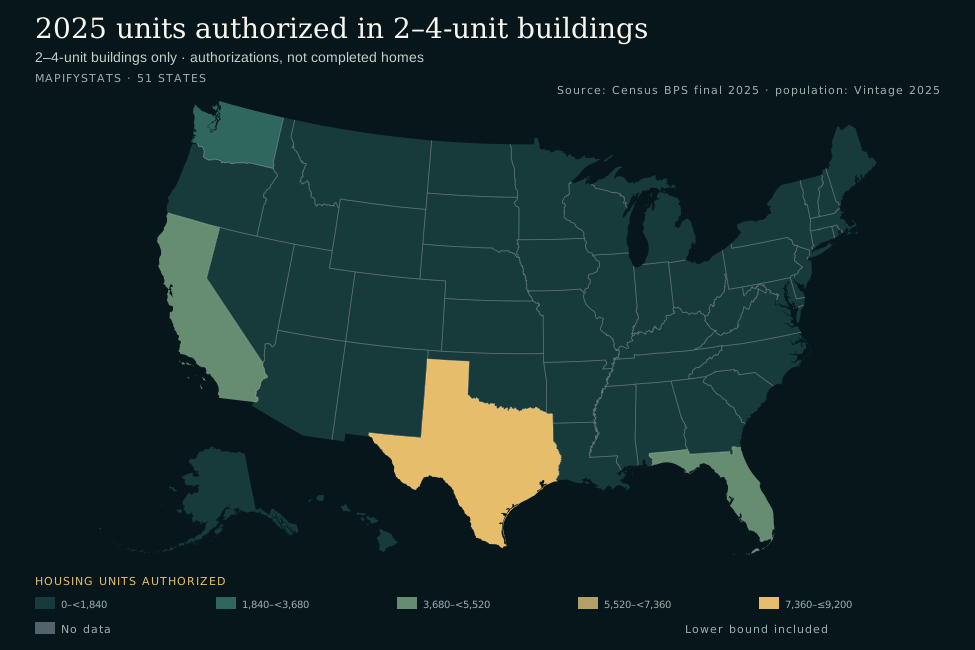
Housing units authorized
Compare the volume of authorized units. Texas leads with 9,133 units; raw counts also reflect a state's population size.
- 0–<1,840
- 1,840–<3,680
- 3,680–<5,520
- 5,520–<7,360
- 7,360–≤9,200
- No data
- Lower bound included
Montana
- Units in 2-unit buildings
- Units in 3–4-unit buildings
- Units in 2–4-unit buildings
- All authorized units
- July 1, 2025 population
- Share of authorizations
- Units per 1,000 residents
All 50 states and DC
Activate a heading to sort, then activate it again to reverse. Shares display two decimals and rates three; sorting and CSV retain full precision. DC is included in all views and downloads, with no state rank.
Scroll horizontally to see every column →
| Alabama | 132 | 228 | 360 | 19,061 | 5,193,088 | 1.89 | 0.069 | 48 |
|---|---|---|---|---|---|---|---|---|
| Alaska | 72 | 44 | 116 | 848 | 737,270 | 13.68 | 0.157 | 26 |
| Arizona | 1,178 | 292 | 1,470 | 51,532 | 7,623,818 | 2.85 | 0.193 | 20 |
| Arkansas | 970 | 310 | 1,280 | 15,492 | 3,114,791 | 8.26 | 0.411 | 5 |
| California | 3,496 | 1,137 | 4,633 | 103,856 | 39,355,309 | 4.46 | 0.118 | 35 |
| Colorado | 462 | 240 | 702 | 33,754 | 6,012,561 | 2.08 | 0.117 | 36 |
| Connecticut | 208 | 148 | 356 | 7,273 | 3,688,496 | 4.89 | 0.097 | 40 |
| Delaware | 170 | 0 | 170 | 6,468 | 1,059,952 | 2.63 | 0.160 | 25 |
| District of Columbia | 38 | 0 | 38 | 1,591 | 693,645 | 2.39 | 0.055 | Unranked |
| Florida | 2,644 | 1,405 | 4,049 | 178,297 | 23,462,518 | 2.27 | 0.173 | 22 |
| Georgia | 708 | 641 | 1,349 | 61,196 | 11,302,748 | 2.20 | 0.119 | 34 |
| Hawaii | 210 | 8 | 218 | 3,708 | 1,432,820 | 5.88 | 0.152 | 27 |
| Idaho | 340 | 566 | 906 | 17,944 | 2,029,733 | 5.05 | 0.446 | 4 |
| Illinois | 614 | 849 | 1,463 | 18,551 | 12,719,141 | 7.89 | 0.115 | 37 |
| Indiana | 506 | 164 | 670 | 29,076 | 6,973,333 | 2.30 | 0.096 | 41 |
| Iowa | 432 | 322 | 754 | 13,664 | 3,238,387 | 5.52 | 0.233 | 12 |
| Kansas | 1,612 | 171 | 1,783 | 10,299 | 2,977,220 | 17.31 | 0.599 | 2 |
| Kentucky | 714 | 303 | 1,017 | 14,940 | 4,606,864 | 6.81 | 0.221 | 15 |
| Louisiana | 520 | 69 | 589 | 14,203 | 4,618,189 | 4.15 | 0.128 | 30 |
| Maine | 244 | 97 | 341 | 6,979 | 1,414,874 | 4.89 | 0.241 | 11 |
| Maryland | 420 | 23 | 443 | 13,358 | 6,265,347 | 3.32 | 0.071 | 47 |
| Massachusetts | 438 | 197 | 635 | 12,477 | 7,154,084 | 5.09 | 0.089 | 44 |
| Michigan | 726 | 517 | 1,243 | 23,075 | 10,127,884 | 5.39 | 0.123 | 32 |
| Minnesota | 310 | 279 | 589 | 20,947 | 5,830,405 | 2.81 | 0.101 | 39 |
| Mississippi | 152 | 47 | 199 | 8,405 | 2,954,160 | 2.37 | 0.067 | 49 |
| Missouri | 718 | 616 | 1,334 | 17,474 | 6,270,541 | 7.63 | 0.213 | 17 |
| Montana | 360 | 340 | 700 | 5,258 | 1,144,694 | 13.31 | 0.612 | 1 |
| Nebraska | 356 | 195 | 551 | 10,596 | 2,018,006 | 5.20 | 0.273 | 7 |
| Nevada | 474 | 122 | 596 | 18,540 | 3,282,188 | 3.21 | 0.182 | 21 |
| New Hampshire | 166 | 157 | 323 | 5,030 | 1,415,342 | 6.42 | 0.228 | 13 |
| New Jersey | 818 | 733 | 1,551 | 27,661 | 9,548,215 | 5.61 | 0.162 | 24 |
| New Mexico | 162 | 25 | 187 | 7,747 | 2,125,498 | 2.41 | 0.088 | 45 |
| New York | 1,098 | 681 | 1,779 | 38,667 | 20,002,427 | 4.60 | 0.089 | 43 |
| North Carolina | 1,086 | 320 | 1,406 | 86,167 | 11,197,968 | 1.63 | 0.126 | 31 |
| North Dakota | 56 | 10 | 66 | 2,440 | 799,358 | 2.70 | 0.083 | 46 |
| Ohio | 832 | 924 | 1,756 | 33,640 | 11,900,510 | 5.22 | 0.148 | 28 |
| Oklahoma | 868 | 248 | 1,116 | 15,513 | 4,123,288 | 7.19 | 0.271 | 9 |
| Oregon | 480 | 219 | 699 | 14,839 | 4,273,586 | 4.71 | 0.164 | 23 |
| Pennsylvania | 518 | 704 | 1,222 | 25,709 | 13,059,432 | 4.75 | 0.094 | 42 |
| Rhode Island | 350 | 148 | 498 | 1,738 | 1,114,521 | 28.65 | 0.447 | 3 |
| South Carolina | 416 | 368 | 784 | 45,862 | 5,570,274 | 1.71 | 0.141 | 29 |
| South Dakota | 100 | 107 | 207 | 5,305 | 935,094 | 3.90 | 0.221 | 14 |
| Tennessee | 426 | 453 | 879 | 43,374 | 7,315,076 | 2.03 | 0.120 | 33 |
| Texas | 6,356 | 2,777 | 9,133 | 210,217 | 31,709,821 | 4.34 | 0.288 | 6 |
| Utah | 202 | 578 | 780 | 26,775 | 3,538,904 | 2.91 | 0.220 | 16 |
| Vermont | 92 | 39 | 131 | 2,294 | 644,663 | 5.71 | 0.203 | 18 |
| Virginia | 500 | 94 | 594 | 33,094 | 8,880,107 | 1.79 | 0.067 | 50 |
| Washington | 1,342 | 790 | 2,132 | 34,913 | 8,001,020 | 6.11 | 0.266 | 10 |
| West Virginia | 72 | 126 | 198 | 3,962 | 1,766,147 | 5.00 | 0.112 | 38 |
| Wisconsin | 1,536 | 92 | 1,628 | 25,569 | 5,972,787 | 6.37 | 0.273 | 8 |
| Wyoming | 48 | 70 | 118 | 2,238 | 588,753 | 5.27 | 0.200 | 19 |
Three different questions, three different leaders
Texas has the largest count, Montana has the highest rate per resident, and Rhode Island has the highest share of total authorizations. These comparisons describe scale, population-adjusted activity, and the mix of authorized housing respectively.
Rhode Island's 498 small-building units are 28.65% of its 1,738 total authorized units. Texas's 9,133 small-building units are 4.34% of its 210,217 total. A higher share therefore does not establish a higher volume or rate of construction. State totals also hide substantial local differences.
What this category includes
Small-building units = units in 2-unit buildings + units in 3–4-unit buildings. Each apartment counts as one housing unit. These are new privately owned residential authorizations, not building counts, individual permit documents, housing starts, completions, or net additions after demolition.
This is a narrow slice of missing-middle housing. Census classifies many attached townhouses as 1-unit structures; the 5+ category also includes some smaller apartment buildings. Conversions within existing buildings are excluded. The figures do not identify every ADU, housing form, walkable location, affordability level, tenure, or zoning program.
Do not infer that a state's laws caused its rank or that authorized homes were built. Areas where permits are not required are excluded, and estimates include imputation and nonsampling error. Small counts and close ranks may not represent meaningful differences. Explore population growth for related context.
Calculations and sources
Share = 2–4-unit units ÷ all authorized units × 100. Rate = 2–4-unit units ÷ July 1, 2025 resident population × 1,000. The same Census population vintage is used for every state. The national share uses national totals rather than averaging state percentages. Ranks compare the 50 states at full precision; equal values share a rank. DC remains unranked.
Source: Census Building Permits Survey, final 2025 annual release published May 14, 2026, retrieved October 1, 2026; official state workbook, “State Units Ann” sheet. The last column counts 5+ unit buildings and is excluded from unit sums. Population comes from Census Vintage 2025, July 1 estimates.
All 51 state/DC joins and all four unit categories reconcile to the national totals: 36,748 + 18,993 = 55,741 small-building units, out of 1,431,616 total authorizations. Population sums to 341,784,857. Counts are preserved exactly; derived values are rounded only for display. The source snapshot is frozen for 2025; partial 2026 figures are not mixed into this comparison.
Census definitions · Methods and limitations
Archived official workbook · Extracted source counts · Archived population CSV · Calculated data and checksums