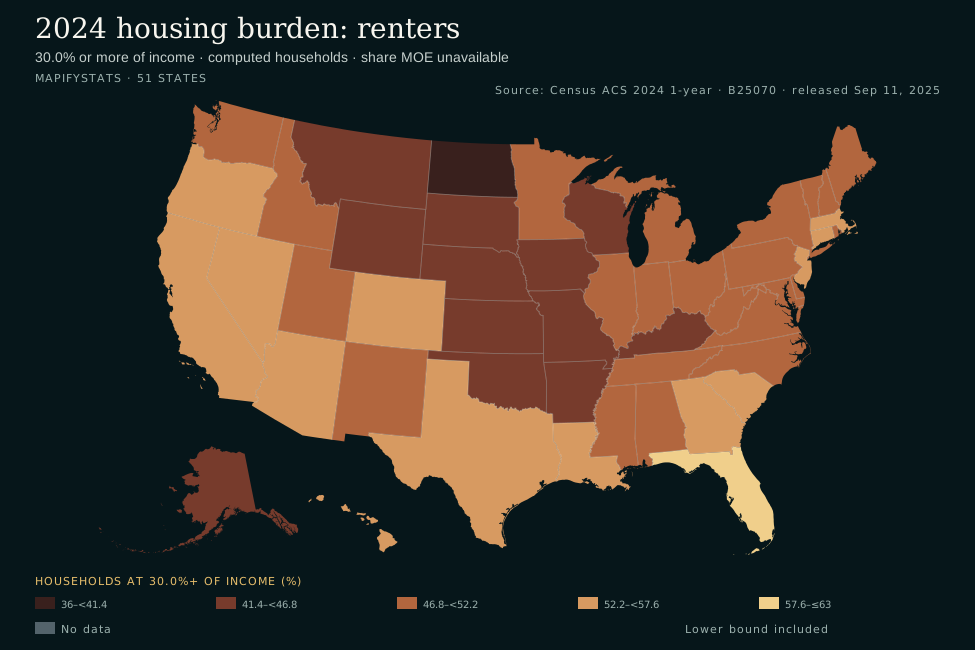
Reading renter and owner differences
A renter's gross rent and an owner's selected monthly costs describe different bills. Gross rent includes contract rent and tenant-paid utilities. Owner costs include mortgage payments when present, property taxes, insurance, utilities and applicable HOA or condominium fees. Paying off a mortgage removes a major payment, but it does not remove every housing expense. A household with low retirement income can still spend a large share on taxes and insurance.
The U.S. estimates above show a larger burdened share among renters than among owners in either mortgage group. That is a description of the households surveyed, not a prediction that buying will lower a particular renter's costs. Renters and owners differ in income, age, household composition, location and when they entered the housing market. Existing owners may have bought at earlier prices or locked in a different interest rate. A new buyer faces today's purchase price and financing terms, which this map does not estimate.
Why low rent can still be unaffordable
The dollar bill is only half of affordability. For an illustrative household, $900 a month uses 45% of a $2,000 monthly income; $1,500 uses 25% of a $6,000 income. The lower rent has the higher burden. This is arithmetic, not a finding about any state. A state can have inexpensive homes and also have many residents with incomes too low to comfortably pay for them.
Median rent is the middle rent bill, while this explorer counts individual households whose own cost-to-income ratio meets a threshold. Dividing a state's median rent by its median income will not recover this share. State averages also hide neighborhood variation, household size, housing quality and transportation costs. Use the map to ask where housing consumes more income, then investigate the local wages, housing supply and household circumstances behind that pattern.
Methods and denominators
The unit is an occupied housing unit, corresponding to a household, not a person. B25070 covers renter-occupied housing units; B25091 covers owner-occupied housing units and separates mortgage status. We use these detailed tables because S2503 Financial Characteristics groups costs by income and tenure but does not supply this mortgage-status and 50.0%+ comparison.
For each geography and group, computed households = the group's total − its “not computed” count. The 30.0% or more numerator is the sum of the 30.0–34.9, 35.0–39.9, 40.0–49.9 and 50.0% or more categories. The 50.0% or more numerator is that single category. Share = numerator ÷ computed households × 100. The 50%+ households are already included in 30%+; do not add the two shares. These bounds include 30.0 and 50.0, following the published categories. Census rounds renter ratios to the nearest tenth and owner ratios to the nearest whole percentage before categorization; we retain its category assignments.
| Group | Total | Not computed | 30.0%+ sum | 50.0%+ |
|---|---|---|---|---|
| Renters · B25070 | 001E | 011E | 007E–010E | 010E |
| With mortgage · B25091 | 002E | 012E | 008E–011E | 011E |
| Without mortgage · B25091 | 013E | 023E | 019E–022E | 022E |
For renters, “not computed” includes households paying no rent and those reporting no income or a net loss. For owners it includes no-income and net-loss households. Excluding them does not mean they have no housing difficulties. The table and CSV expose these exclusions so a reader can assess coverage. A genuine zero count remains zero; a zero denominator produces an unavailable share. Unknown, blank, suppressed and Census special values are treated as missing, never as zero; an incomplete source partition cannot silently produce a percentage. All required estimates in this frozen state/DC snapshot are available.
Uncertainty and limits
The ACS is a sample survey. Published count margins of error describe 90% confidence levels; they are not additional households. The archive retains every category estimate and MOE. The all-counts CSV includes the published total, not-computed and single-category 50%+ count MOEs. We have not calculated MOEs for the summed 30%+ numerator, subtracted denominator, derived shares or differences between groups. Those are explicitly unavailable. A category count's MOE cannot be reused as a percentage MOE, and category MOEs cannot simply be added. Consult Census guidance for derived estimates and statistical comparisons before inferring that two shares differ beyond sampling uncertainty.
The ranking is an ordering of point estimates, not a statistically tested league table. Close ranks can change with sampling error, and rounding can make different estimates look identical. A 30% threshold is a common burden screen, not an individual household budget test: it does not measure money left for food or childcare, wealth, debts, repair bills or the cost of moving. This is a 2024 annual survey estimate with household income measured over the prior 12 months, not a current listing-price or mortgage-qualification tool.
Why there is no 2019 trend yet
We defer a 2019 comparison across these three groups. Starting in 2024, owner costs incorporate HOA fees through a revised question, and maximum allowed values for some owner-cost components changed in 2020. A before/after owner difference could reflect measurement as well as economic change. A future trend needs a separate comparability review and uncertainty calculation; this page does not label that difference as a trend. See the 2024 subject definitions, pages 19–20 and 38–40.
Sources, dates and reproducibility
Primary source: U.S. Census Bureau, 2024 ACS 1-year B25070 and B25091, released September 11, 2025. Retrieved September 30, 2026 from the official table-based summary files. The ACS updates page checked on September 30 still listed the 2025 one-year release date as undetermined, so this explorer uses the released 2024 product.
The frozen extracts preserve original US, state and Puerto Rico source lines. Only the 50 states and DC enter the explorer; Puerto Rico, territories and smaller geographies are excluded. Every estimate column sums to the source's U.S. estimate, every burden category partition reconciles to its total, and all renter/owner totals match the separate B25003 tenure table. California, Texas and DC are recorded as spot checks. No MOEs are summed across states. Display uses one decimal; map values, sorting, ranking and CSV preserve unrounded computed shares.
Archived renter estimates and MOEs · Archived owner estimates and MOEs · Download URLs and SHA-256 checksums · Calculated data and validation record
To make a map of a different metric, use the CSV map maker. The customization link above carries the selected group, threshold, units, title and source into that editor. The map CSV can also be imported there; choose one of its six percentage columns and confirm the units.