U.S. Census Bureau · Vintage 2025
2025 Population Growth by State
How each state's resident population changed from July 1, 2024 to July 1, 2025, using the same Census vintage for both years.
Customize this map →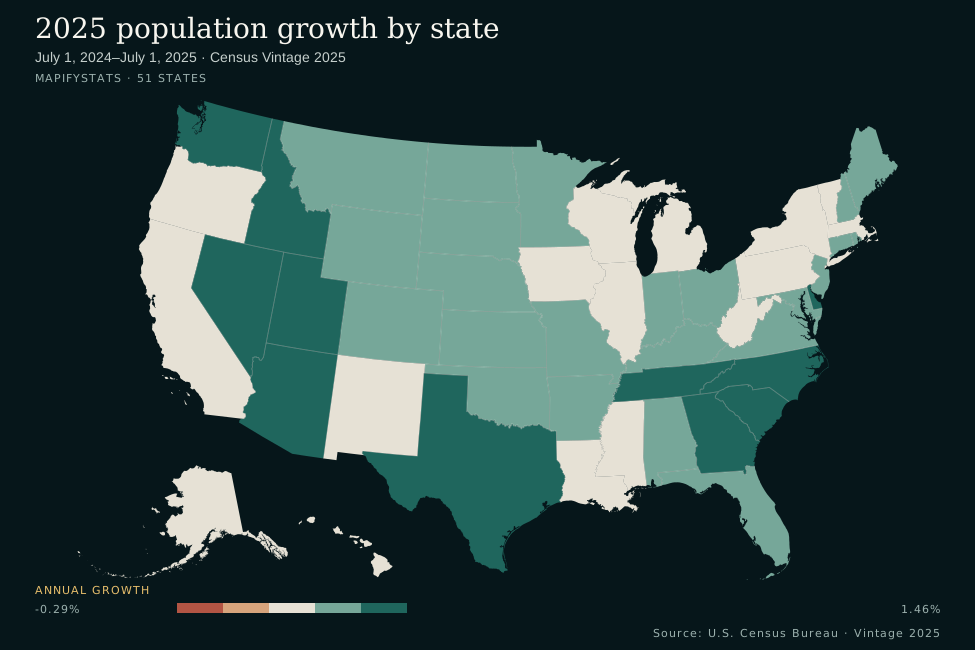
Where population grew fastest
South Carolina led the 50 states in percentage growth (1.46%), followed by Idaho (1.44%) and North Carolina (1.32%). Percentage growth measures relative change; the largest numeric increase may occur in a different state.
All 50 states: population and annual growth
Activate a column heading to sort; activate it again to reverse. Growth percentages are rounded to two decimals for display; sorting and CSV use unrounded values.
| Alabama | 5,163,055 | 5,193,088 | +30,033 | +0.58% |
|---|---|---|---|---|
| Alaska | 736,537 | 737,270 | +733 | +0.10% |
| Arizona | 7,556,424 | 7,623,818 | +67,394 | +0.89% |
| Arkansas | 3,096,080 | 3,114,791 | +18,711 | +0.60% |
| California | 39,364,774 | 39,355,309 | -9,465 | -0.02% |
| Colorado | 5,988,502 | 6,012,561 | +24,059 | +0.40% |
| Connecticut | 3,674,449 | 3,688,496 | +14,047 | +0.38% |
| Delaware | 1,050,123 | 1,059,952 | +9,829 | +0.94% |
| Florida | 23,265,838 | 23,462,518 | +196,680 | +0.85% |
| Georgia | 11,204,208 | 11,302,748 | +98,540 | +0.88% |
| Hawaii | 1,434,952 | 1,432,820 | -2,132 | -0.15% |
| Idaho | 2,000,872 | 2,029,733 | +28,861 | +1.44% |
| Illinois | 12,703,033 | 12,719,141 | +16,108 | +0.13% |
| Indiana | 6,934,754 | 6,973,333 | +38,579 | +0.56% |
| Iowa | 3,230,454 | 3,238,387 | +7,933 | +0.25% |
| Kansas | 2,965,252 | 2,977,220 | +11,968 | +0.40% |
| Kentucky | 4,584,046 | 4,606,864 | +22,818 | +0.50% |
| Louisiana | 4,614,878 | 4,618,189 | +3,311 | +0.07% |
| Maine | 1,408,438 | 1,414,874 | +6,436 | +0.46% |
| Maryland | 6,245,314 | 6,265,347 | +20,033 | +0.32% |
| Massachusetts | 7,138,560 | 7,154,084 | +15,524 | +0.22% |
| Michigan | 10,099,962 | 10,127,884 | +27,922 | +0.28% |
| Minnesota | 5,797,405 | 5,830,405 | +33,000 | +0.57% |
| Mississippi | 2,950,172 | 2,954,160 | +3,988 | +0.14% |
| Missouri | 6,243,544 | 6,270,541 | +26,997 | +0.43% |
| Montana | 1,137,557 | 1,144,694 | +7,137 | +0.63% |
| Nebraska | 2,005,591 | 2,018,006 | +12,415 | +0.62% |
| Nevada | 3,253,543 | 3,282,188 | +28,645 | +0.88% |
| New Hampshire | 1,408,518 | 1,415,342 | +6,824 | +0.48% |
| New Jersey | 9,506,354 | 9,548,215 | +41,861 | +0.44% |
| New Mexico | 2,126,774 | 2,125,498 | -1,276 | -0.06% |
| New York | 20,001,419 | 20,002,427 | +1,008 | +0.01% |
| North Carolina | 11,052,061 | 11,197,968 | +145,907 | +1.32% |
| North Dakota | 793,387 | 799,358 | +5,971 | +0.75% |
| Ohio | 11,860,621 | 11,900,510 | +39,889 | +0.34% |
| Oklahoma | 4,097,758 | 4,123,288 | +25,530 | +0.62% |
| Oregon | 4,265,324 | 4,273,586 | +8,262 | +0.19% |
| Pennsylvania | 13,045,848 | 13,059,432 | +13,584 | +0.10% |
| Rhode Island | 1,110,415 | 1,114,521 | +4,106 | +0.37% |
| South Carolina | 5,490,316 | 5,570,274 | +79,958 | +1.46% |
| South Dakota | 927,110 | 935,094 | +7,984 | +0.86% |
| Tennessee | 7,251,291 | 7,315,076 | +63,785 | +0.88% |
| Texas | 31,318,578 | 31,709,821 | +391,243 | +1.25% |
| Utah | 3,502,983 | 3,538,904 | +35,921 | +1.03% |
| Vermont | 646,521 | 644,663 | -1,858 | -0.29% |
| Virginia | 8,819,642 | 8,880,107 | +60,465 | +0.69% |
| Washington | 7,927,958 | 8,001,020 | +73,062 | +0.92% |
| West Virginia | 1,767,402 | 1,766,147 | -1,255 | -0.07% |
| Wisconsin | 5,957,168 | 5,972,787 | +15,619 | +0.26% |
| Wyoming | 586,722 | 588,753 | +2,031 | +0.35% |
District of Columbia
DC is a federal district, so it is excluded from the 50-state ranking and shown separately here. It is included in the map, customization data and CSV. Its population changed from 691,310 to 693,645, a change of 2,335 (0.34%). Puerto Rico, territories and regional totals are excluded.
Definitions and calculation
Population means the estimated resident population on July 1 of each year, not the April 2020 census count. Numeric change = 2025 population − 2024 population. Growth (%) = (2025 population − 2024 population) ÷ 2024 population × 100. A negative result means the estimated population declined.
These are estimates, not a new census enumeration. Census revises prior years with each vintage. Both columns come from Vintage 2025; comparing the 2025 figure against a 2024 figure from an older release can produce a different result. The map shades annual percentage growth, with a diverging color palette. The table supplies exact population counts and numeric changes.
Source and download
Source: U.S. Census Bureau, State Population Totals and Components of Change: 2020–2025. Released January 2026; downloaded September 30, 2026. Dataset: NST-EST2025-ALLDATA.csv. Fields used: NAME, STATE, SUMLEV, POPESTIMATE2024 and POPESTIMATE2025; calculated changes checked against NPOPCHG_2025.
Download the archived official source CSV · Download the calculated growth CSV
All 51 state/DC records were validated; their population totals equal the source's U.S. totals in both years. See data and source checksum for reproducible provenance.
Customize this map →