Political biography · State presidential returns
Washington
election history.
Presidential votes, closest contests and political movement from 2000 through 2024.
Saved history is ready below. Interactive controls require JavaScript.
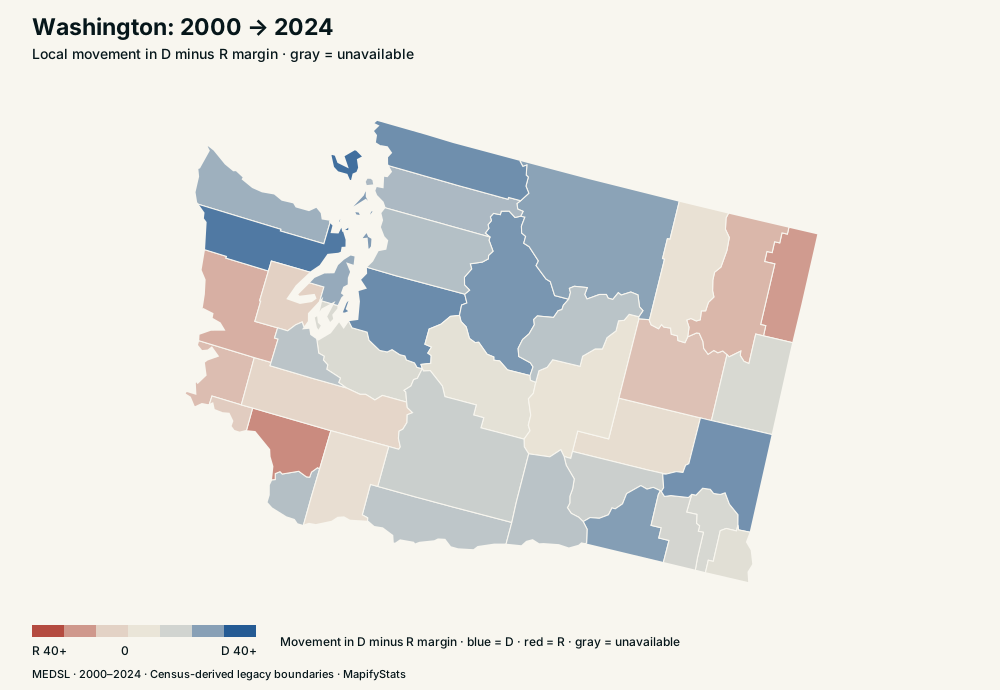
State context · blue toward D · red toward R · gray unavailable
How Washington voted
In 2000, Washington recorded 1,247,652 Democratic votes and 1,108,864 Republican votes out of 2,487,433 ballots. In 2024, the corresponding counts were 2,245,849, 1,530,923 and 3,924,243. The margin was D +5.58 in 2000 and D +18.22 in 2024.
The closest available D/R contest was 2000, with a D +5.58 margin. Movement relative to the country is local margin change minus national margin change; it distinguishes a local shift from a nationwide wave.
| Election | Democratic votes | Republican votes | Other ballots | Total ballots | D share | R share | D−R margin | U.S. margin |
|---|---|---|---|---|---|---|---|---|
| 2000 | 1,247,652 | 1,108,864 | 130,917 | 2,487,433 | 50.16% | 44.58% | D +5.58 | D +0.49 |
| 2004 | 1,510,201 | 1,304,894 | 43,989 | 2,859,084 | 52.82% | 45.64% | D +7.18 | R +2.43 |
| 2008 | 1,750,848 | 1,229,216 | 56,814 | 3,036,878 | 57.65% | 40.48% | D +17.18 | D +7.40 |
| 2012 | 1,755,396 | 1,290,670 | 79,450 | 3,125,516 | 56.16% | 41.29% | D +14.87 | D +3.94 |
| 2016 | 1,742,718 | 1,221,747 | 352,554 | 3,317,019 | 52.54% | 36.83% | D +15.71 | D +2.18 |
| 2020 | 2,369,612 | 1,584,651 | 133,368 | 4,087,631 | 57.97% | 38.77% | D +19.20 | D +4.45 |
| 2024 | 2,245,849 | 1,530,923 | 147,471 | 3,924,243 | 57.23% | 39.01% | D +18.22 | R +1.47 |
Washington county election histories
- Pierce County →
- Adams County →
- Pend Oreille County →
- King County →
- Chelan County →
- Kittitas County →
- Garfield County →
- Grant County →
- Okanogan County →
- Franklin County →
- Klickitat County →
- Clark County →
- Skagit County →
- Walla Walla County →
- Pacific County →
- Cowlitz County →
- Wahkiakum County →
- Lewis County →
- Clallam County →
- Grays Harbor County →
- Jefferson County →
- Lincoln County →
- Mason County →
- San Juan County →
- Stevens County →
- Whatcom County →
- Douglas County →
- Snohomish County →
- Thurston County →
- Columbia County →
- Yakima County →
- Benton County →
- Island County →
- Spokane County →
- Whitman County →
- Ferry County →
- Skamania County →
- Asotin County →
- Kitsap County →
Sources and methods
Presidential votes: MIT Election Data and Science Lab county returns, 2000–2024, version 20 and MEDSL statewide presidential returns. Percentages use all recorded ballots; the margin is Democratic share minus Republican share. “Other ballots” is total ballots minus Democratic and Republican votes. It includes third-party/write-in votes and any residual or invalid ballot counts included in the source denominator; it is not necessarily a count of votes for other candidates. A swing is the difference between two margins; national-adjusted swing subtracts the U.S. change over the same period. State and national profiles use statewide returns, not sums of incomplete county returns.
The county original CSV is an archived public mirror of MEDSL’s February 25, 2026 revision, with matching revision and original file size. Direct Harvard downloads require a personal guestbook; an independent official checksum match has not been certified. Download links, provenance, selection rules and SHA-256 checksums document the source and preserve the exact bytes used here. Recorded electoral votes come from the National Archives, including split Maine/Nebraska districts, faithless electors and abstentions.
Maps use the Census-derived us-atlas legacy county boundaries. Connecticut retains eight legacy counties, matching these returns. Oglala Lakota’s FIPS rename is harmonized. Bedford city and county are added for years before their merger when valid returns exist. Comparisons crossing Broomfield’s 2001 creation are unavailable for the five affected Colorado counties. Alaska’s voting districts and separately reported Kansas City votes cannot be safely assigned to these county boundaries: use statewide history and whole-state merges. Missing or inconsistent returns stay unavailable.
Border Lab uses 2020 Census resident population bases, Vintage 2021, with legacy Connecticut counties. Alaska’s statewide population remains intact. Statewide votes not assigned to comparable counties stay with their original state; a whole-state merge transfers that residual. A move with missing historical votes makes that election replay unavailable. The population snapshot stays fixed across historical replays. Metro experiments use March 2020 Census metropolitan delineations; these statistical areas are not proposed legal states. The population-balancing preset starts from original borders and greedily transfers adjacent counties to reduce squared imbalance without increasing graph fragmentation, up to 150 transfers. It preserves 50 regions and does not promise an optimal or equal-population partition.
House seats use the Census equal-proportions method: one initial seat per region, then priority population ÷ √(n × (n + 1)). Border Lab uses resident population; Same Votes, Different Rules uses historical Census apportionment populations, which include allocated overseas residents. Proportional electoral allocation uses Hamilton largest remainder with whole electors, across D, R and a combined other-ballot bucket; exact remainder ties use D, then R, then other. Winner-takes-all ties leave electors unallocated. No majority is reported honestly; contingent-election outcomes are not simulated.
These experiments hold recorded votes fixed. They are mechanical counterfactuals, not predictions of behavior, turnout, campaigns or constitutional validity. Ordinary vote totals cannot recover ranked preferences. Twin matches require complete comparable histories across the selected period; RMS distance equally weights each election margin or each consecutive change. Equal movement does not imply similar political levels, demographics, motives or individual voters.