U.S. Census Bureau · Vintage 2025
2025 Net Domestic Migration by State
Domestic arrivals minus domestic departures from July 1, 2024 through June 30, 2025. Compare both people and rates per 1,000 residents.
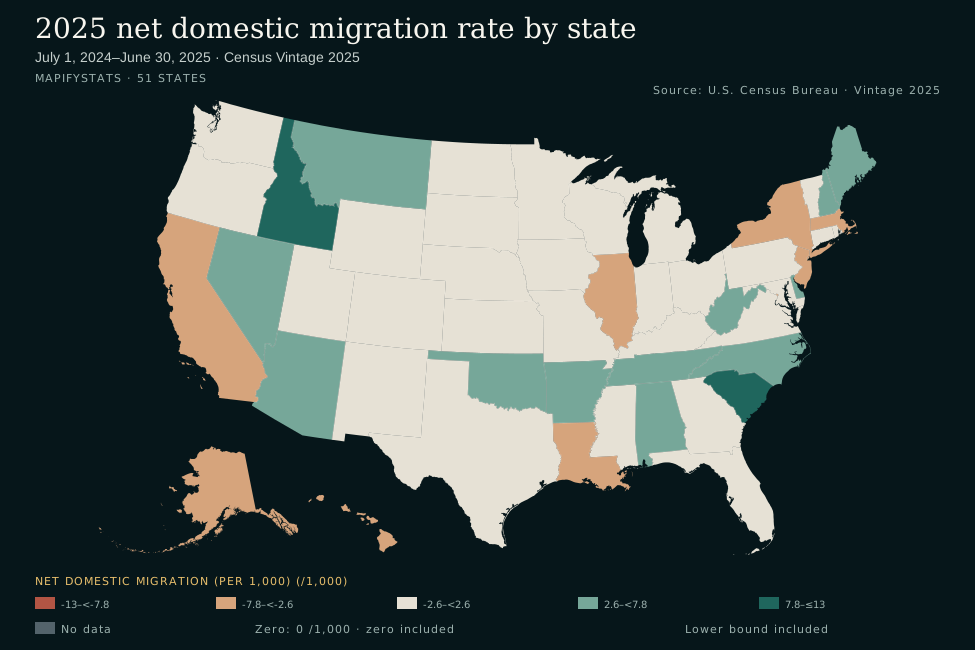
Net migration rate: compare relative to population
Rates measure net domestic migration per 1,000 residents, making differently sized states easier to compare. South Carolina led the 50 states at 12.05 per 1,000.
- -13–<-7.8
- -7.8–<-2.6
- -2.6–<2.6
- 2.6–<7.8
- 7.8–≤13
- No data
- Lower bound included
- Zero: 0 /1,000 · zero included
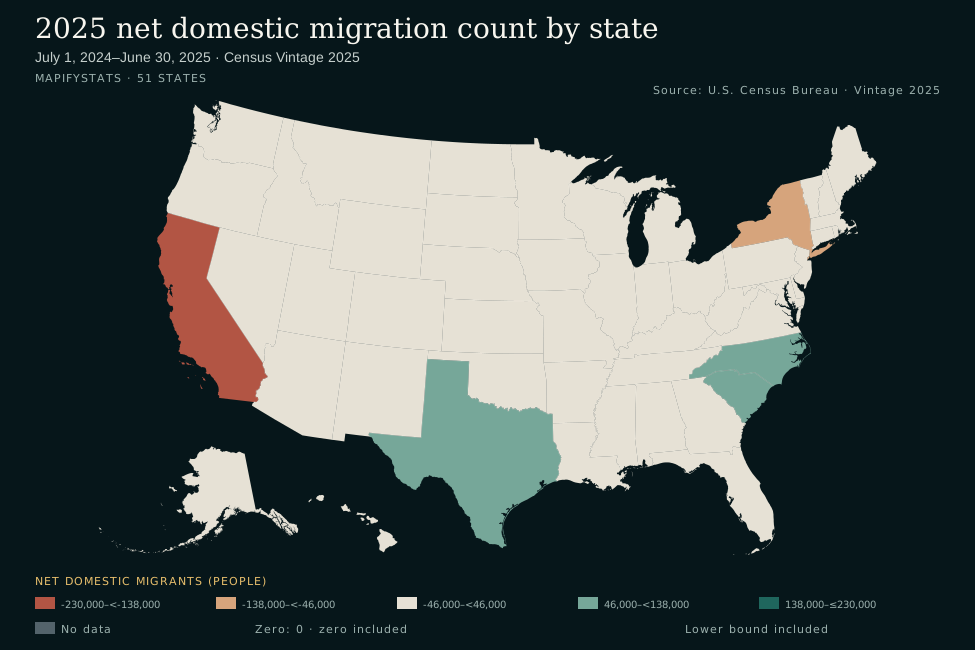
Net migration count: gains and losses in people
Counts measure the size of each state's net domestic gain or loss. North Carolina led the 50 states at 84,064 people.
- -230,000–<-138,000
- -138,000–<-46,000
- -46,000–<46,000
- 46,000–<138,000
- 138,000–≤230,000
- No data
- Lower bound included
- Zero: 0 · zero included
All 50 states and DC: counts, rates and state rankings
Activate a column heading to sort, then activate again to reverse. Rates display two decimals; sorting and downloads preserve source precision. Rankings compare only the 50 states; DC is a federal district and has no state rank.
| Alabama | 23,358 | 4.51 | 7 | 11 |
|---|---|---|---|---|
| Alaska | -4,525 | -6.14 | 40 | 48 |
| Arizona | 31,107 | 4.10 | 5 | 12 |
| Arkansas | 14,475 | 4.66 | 12 | 8 |
| California | -229,077 | -5.82 | 50 | 47 |
| Colorado | -12,100 | -2.02 | 43 | 42 |
| Connecticut | -5,945 | -1.61 | 41 | 40 |
| Delaware | 6,855 | 6.50 | 21 | 4 |
| District of Columbia | -4,128 | -5.96 | Unranked | Unranked |
| Florida | 22,517 | 0.96 | 8 | 26 |
| Georgia | 27,333 | 2.43 | 6 | 16 |
| Hawaii | -8,876 | -6.19 | 42 | 49 |
| Idaho | 19,915 | 9.88 | 9 | 2 |
| Illinois | -40,017 | -3.15 | 48 | 44 |
| Indiana | 12,197 | 1.75 | 14 | 20 |
| Iowa | -970 | -0.30 | 36 | 35 |
| Kansas | -519 | -0.17 | 33 | 32 |
| Kentucky | 7,269 | 1.58 | 19 | 21 |
| Louisiana | -14,387 | -3.12 | 45 | 43 |
| Maine | 7,406 | 5.25 | 18 | 7 |
| Maryland | -12,127 | -1.94 | 44 | 41 |
| Massachusetts | -33,340 | -4.67 | 46 | 46 |
| Michigan | 1,796 | 0.18 | 29 | 31 |
| Minnesota | 8,300 | 1.43 | 17 | 22 |
| Mississippi | -917 | -0.31 | 35 | 36 |
| Missouri | 14,028 | 2.24 | 13 | 18 |
| Montana | 6,348 | 5.56 | 24 | 6 |
| Nebraska | -366 | -0.18 | 32 | 33 |
| Nevada | 14,914 | 4.56 | 10 | 10 |
| New Hampshire | 6,554 | 4.64 | 22 | 9 |
| New Jersey | -37,428 | -3.93 | 47 | 45 |
| New Mexico | -2,267 | -1.07 | 38 | 37 |
| New York | -137,586 | -6.88 | 49 | 50 |
| North Carolina | 84,064 | 7.56 | 1 | 3 |
| North Dakota | 512 | 0.64 | 31 | 29 |
| Ohio | 11,926 | 1.00 | 15 | 25 |
| Oklahoma | 14,492 | 3.53 | 11 | 14 |
| Oregon | 2,228 | 0.52 | 27 | 30 |
| Pennsylvania | -2,936 | -0.22 | 39 | 34 |
| Rhode Island | -1,551 | -1.39 | 37 | 39 |
| South Carolina | 66,622 | 12.05 | 3 | 1 |
| South Dakota | 2,169 | 2.33 | 28 | 17 |
| Tennessee | 42,389 | 5.82 | 4 | 5 |
| Texas | 67,299 | 2.14 | 2 | 19 |
| Utah | 3,343 | 0.95 | 26 | 27 |
| Vermont | -726 | -1.12 | 34 | 38 |
| Virginia | 6,268 | 0.71 | 25 | 28 |
| Washington | 9,238 | 1.16 | 16 | 24 |
| West Virginia | 6,408 | 3.63 | 23 | 13 |
| Wisconsin | 6,984 | 1.17 | 20 | 23 |
| Wyoming | 1,474 | 2.51 | 30 | 15 |
What net domestic migration measures
A positive value means more people moved into the area from elsewhere in the United States than moved out to elsewhere in the United States; a negative value means the reverse. Domestic moves exclude Puerto Rico. Net migration is the balance of arrivals and departures, not the gross number of movers. A small net balance can coexist with many moves in both directions.
International migration crosses U.S. borders and is a separate component, including moves between the United States and Puerto Rico. Total population growth also includes births, deaths, international migration and a residual adjustment. A domestic net loss therefore does not necessarily mean a state's total population declined.
This snapshot supplies net balances, not state-to-state origins or destinations. It cannot explain why people moved. No causes or bilateral flows are inferred here.
Methodology and source
Counts use DOMESTICMIG2025. Rates use RDOMESTICMIG2025 directly at source precision. The rate equals net domestic migrants ÷ the average of the July 1, 2024 and July 1, 2025 resident population estimates × 1,000. This average approximates the population at the midpoint of the period. These are Census estimates, not a count of every move; future vintages may revise them.
The diverging maps use symmetric color domains around zero, with labeled class intervals. The central class straddles zero; its interval labels show the small gains and losses it includes. DC is included in both maps and CSV, but excluded from the 50-state rankings. Puerto Rico, territories and aggregate rows are excluded.
Source: Census State Population Totals and Components of Change: 2020–2025; official file layout; Census component definitions. Released January 2026; snapshot retrieved September 30, 2026. All 51 records match the archived source; net domestic counts sum to zero, matching the national domestic balance. Rates are not additive.
Archived official CSV · Migration CSV · Data and source checksum