U.S. Energy Information Administration
Power Outage Reliability by State
Compare annual outage hours and interruptions per customer, with major events included or excluded.
EIA distribution reliability · 2019–2024 · historical annual averages
Explore every state ↓2024 · major events included
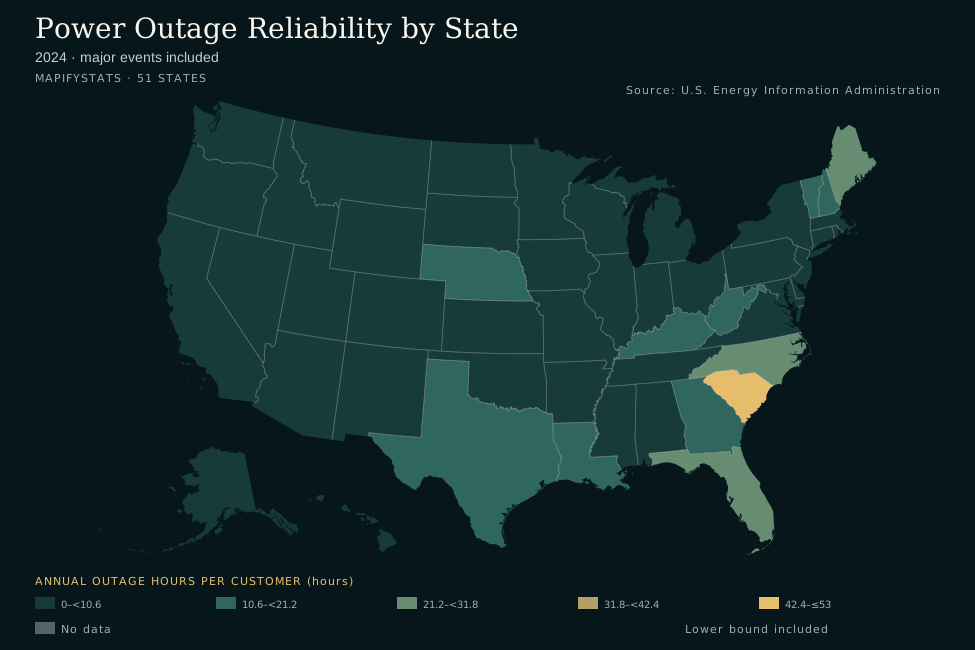
- 0–<10.6
- 10.6–<21.2
- 21.2–<31.8
- 31.8–<42.4
- 42.4–≤53
- No data
- Lower bound included
State estimates and source notes are available below. Enable JavaScript for interactive comparisons.
Compare two states
Historical comparison
Scroll the chart horizontally to see the full period →
View chart values as a table
All 50 states and DC
South Carolina has the highest selected point estimate (52.28 hours); South Dakota has the lowest (1.41 hours).
2024 · major events included
Scroll horizontally to see every column →
| Alabama | 4.66 hours | 1.870 /year | 80.7% | 27 |
|---|---|---|---|---|
| Alaska | 5.45 hours | 2.591 /year | 84.2% | 22 |
| Arizona | 1.46 hours | 0.988 /year | 96.6% | 49 |
| Arkansas | 8.49 hours | 2.128 /year | 89.2% | 17 |
| California | 4.66 hours | 1.345 /year | 100.0% | 26 |
| Colorado | 4.25 hours | 1.409 /year | 93.7% | 32 |
| Connecticut | 2.56 hours | 0.876 /year | 101.2% | 41 |
| Delaware | 1.93 hours | 0.843 /year | 89.1% | 45 |
| District of Columbia | 0.54 hours | 0.271 /year | 98.9% | Unranked |
| Florida | 22.03 hours | 1.770 /year | 100.4% | 4 |
| Georgia | 20.49 hours | 2.122 /year | 88.9% | 6 |
| Hawaii | 5.34 hours | 2.616 /year | 99.9% | 23 |
| Idaho | 3.88 hours | 1.314 /year | 95.1% | 33 |
| Illinois | 2.62 hours | 0.852 /year | 98.1% | 40 |
| Indiana | 5.21 hours | 1.283 /year | 92.0% | 24 |
| Iowa | 2.78 hours | 1.150 /year | 85.4% | 38 |
| Kansas | 4.76 hours | 1.506 /year | 82.4% | 25 |
| Kentucky | 10.81 hours | 1.955 /year | 96.5% | 11 |
| Louisiana | 12.13 hours | 2.722 /year | 93.5% | 9 |
| Maine | 29.14 hours | 3.636 /year | 100.3% | 2 |
| Maryland | 1.97 hours | 0.817 /year | 98.6% | 44 |
| Massachusetts | 1.70 hours | 0.843 /year | 92.3% | 47 |
| Michigan | 7.84 hours | 1.356 /year | 97.5% | 18 |
| Minnesota | 3.66 hours | 1.250 /year | 89.0% | 36 |
| Mississippi | 9.45 hours | 2.555 /year | 83.2% | 15 |
| Missouri | 3.74 hours | 1.189 /year | 86.7% | 34 |
| Montana | 5.86 hours | 1.621 /year | 74.7% | 20 |
| Nebraska | 10.70 hours | 1.232 /year | 73.7% | 12 |
| Nevada | 2.65 hours | 1.108 /year | 103.1% | 39 |
| New Hampshire | 15.38 hours | 2.021 /year | 99.2% | 8 |
| New Jersey | 2.90 hours | 1.119 /year | 100.9% | 37 |
| New Mexico | 4.65 hours | 1.321 /year | 90.1% | 28 |
| New York | 3.67 hours | 0.910 /year | 98.2% | 35 |
| North Carolina | 24.02 hours | 1.812 /year | 96.0% | 3 |
| North Dakota | 1.65 hours | 0.915 /year | 88.5% | 48 |
| Ohio | 8.51 hours | 1.298 /year | 96.6% | 16 |
| Oklahoma | 4.52 hours | 1.731 /year | 90.6% | 30 |
| Oregon | 9.85 hours | 1.346 /year | 93.0% | 14 |
| Pennsylvania | 5.60 hours | 1.353 /year | 94.5% | 21 |
| Rhode Island | 1.74 hours | 0.896 /year | 97.6% | 46 |
| South Carolina | 52.28 hours | 2.365 /year | 96.5% | 1 |
| South Dakota | 1.41 hours | 0.815 /year | 75.4% | 50 |
| Tennessee | 4.64 hours | 2.000 /year | 85.9% | 29 |
| Texas | 21.18 hours | 2.114 /year | 98.1% | 5 |
| Utah | 2.00 hours | 1.030 /year | 88.3% | 43 |
| Vermont | 11.61 hours | 2.516 /year | 87.0% | 10 |
| Virginia | 6.97 hours | 1.627 /year | 96.4% | 19 |
| Washington | 10.39 hours | 1.752 /year | 95.2% | 13 |
| West Virginia | 19.43 hours | 2.832 /year | 97.3% | 7 |
| Wisconsin | 4.44 hours | 1.020 /year | 92.3% | 31 |
| Wyoming | 2.30 hours | 0.999 /year | 76.0% | 42 |
Download every source observation as CSV ↓ · Explorer data (JSON)
Duration and frequency answer different questions
Annual outage hours per customer convert EIA's SAIDI from minutes to hours. SAIFI measures how many non-momentary interruptions the average customer experiences in a year. A state can have frequent short outages or fewer long ones, so look at both measures before drawing conclusions.
Separate major events from routine interruptions
Including major events captures hurricanes and other unusually disruptive events in the reported annual experience. Excluding major events provides another view of distribution reliability. A large difference between the views means those events strongly influenced the annual figure; it does not by itself establish a long-term risk forecast. This historical explorer is not a live outage tracker.
Methodology and coverage
The source is EIA Electric Power Annual Table 11.3, reliability metrics using any reported method. The archived tables provide annual state records for 2019–2024. Newer archived tables take precedence for repeated prior-year observations. Hours = published SAIDI minutes ÷ 60; interruption frequency uses published SAIFI. Published customer coverage is retained as reported, including values over 100%. Differences in reporting coverage and methods limit comparisons.
State averages have practical limits
These are distribution-system averages across reporting utilities, not a prediction for a home, a neighborhood or a specific utility. Reporting coverage is shown in state details. Missing or suppressed values are not converted to zero. Published state averages are not re-aggregated by averaging utility rows, and routine and all-event metrics use the same selected year.
Source and reproducibility
U.S. Energy Information Administration. Sources retrieved October 1, 2026. The snapshot stays fixed until a reviewed data refresh; this page does not claim live data.
Archived source files, selection rules and SHA-256 checksums.
Common questions
Does the highest outage duration mean the worst grid?
Not necessarily. A single major event can dominate a year, while utility coverage and geography also affect comparisons.
Can I use this to predict my next outage?
No. These are historical averages, not forecasts or a property-level reliability assessment.