U.S. Census Bureau · ACS 1-year
Home Heating Fuel by State
Compare the fuels households use most for heating, and how the mix has changed.
2019 and 2021–2024 ACS 1-year · occupied homes · no standard 2020 estimate
Explore every state ↓2024 · Electricity · comparison 2019 · ACS 1-year
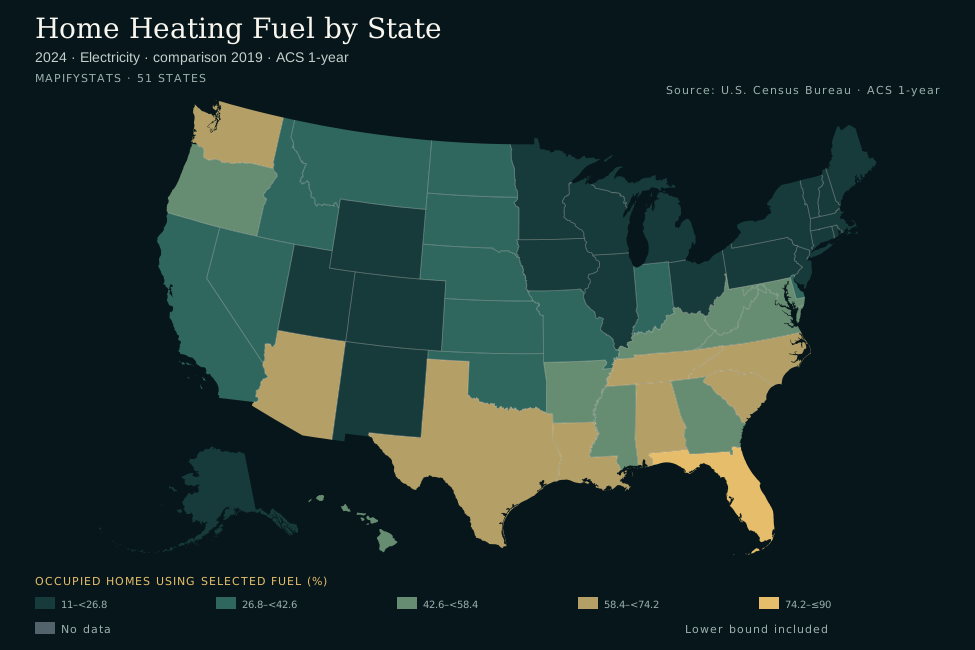
- 11–<26.8
- 26.8–<42.6
- 42.6–<58.4
- 58.4–<74.2
- 74.2–≤90
- No data
- Lower bound included
State estimates and source notes are available below. Enable JavaScript for interactive comparisons.
Compare two states
Historical comparison
Scroll the chart horizontally to see the full period →
View chart values as a table
All 50 states and DC
Florida has the highest selected point estimate (89.7%); Vermont has the lowest (11.8%).
2024 · Electricity · comparison 2019 · ACS 1-year
Scroll horizontally to see every column →
| Alabama | 67.5% | 1,389,802 homes | 1.1 pp | 2,059,528 | ±15,210 | 3 |
|---|---|---|---|---|---|---|
| Alaska | 15.3% | 41,975 homes | 3.2 pp | 274,045 | ±3,060 | 45 |
| Arizona | 59.1% | 1,761,275 homes | -1.4 pp | 2,982,475 | ±13,758 | 9 |
| Arkansas | 54.1% | 674,163 homes | 3.5 pp | 1,246,754 | ±10,134 | 14 |
| California | 30.1% | 4,157,218 homes | 3.5 pp | 13,797,638 | ±31,115 | 28 |
| Colorado | 25.5% | 632,297 homes | 1.9 pp | 2,479,892 | ±14,625 | 33 |
| Connecticut | 20.2% | 293,463 homes | 2.9 pp | 1,455,235 | ±9,455 | 38 |
| Delaware | 39.1% | 161,082 homes | 4.0 pp | 412,304 | ±6,737 | 22 |
| District of Columbia | 49.9% | 164,551 homes | 5.8 pp | 329,687 | ±6,864 | Unranked |
| Florida | 89.7% | 8,198,441 homes | -2.5 pp | 9,141,675 | ±30,279 | 1 |
| Georgia | 57.6% | 2,429,385 homes | 2.0 pp | 4,220,732 | ±19,975 | 12 |
| Hawaii | 44.4% | 219,000 homes | 10.7 pp | 493,151 | ±6,730 | 18 |
| Idaho | 35.1% | 263,648 homes | 0.7 pp | 751,181 | ±6,910 | 23 |
| Illinois | 18.9% | 963,404 homes | 1.8 pp | 5,105,448 | ±20,227 | 40 |
| Indiana | 32.1% | 891,938 homes | 2.4 pp | 2,775,637 | ±13,551 | 25 |
| Iowa | 25.3% | 339,388 homes | 1.6 pp | 1,343,422 | ±7,572 | 34 |
| Kansas | 26.9% | 324,483 homes | 1.5 pp | 1,204,374 | ±8,385 | 30 |
| Kentucky | 55.4% | 1,033,715 homes | 2.7 pp | 1,865,456 | ±13,084 | 13 |
| Louisiana | 63.7% | 1,178,511 homes | -0.2 pp | 1,848,965 | ±12,538 | 6 |
| Maine | 13.5% | 83,361 homes | 5.2 pp | 615,235 | ±4,235 | 47 |
| Maryland | 45.4% | 1,089,518 homes | 3.2 pp | 2,401,394 | ±14,785 | 17 |
| Massachusetts | 20.5% | 578,927 homes | 3.5 pp | 2,829,804 | ±11,578 | 37 |
| Michigan | 12.5% | 518,174 homes | 2.4 pp | 4,131,281 | ±12,231 | 48 |
| Minnesota | 19.9% | 470,053 homes | 2.6 pp | 2,363,442 | ±10,509 | 39 |
| Mississippi | 57.8% | 679,675 homes | -0.3 pp | 1,176,690 | ±10,061 | 10 |
| Missouri | 39.2% | 1,004,835 homes | 2.1 pp | 2,563,244 | ±12,986 | 21 |
| Montana | 28.4% | 133,123 homes | 2.2 pp | 468,981 | ±4,801 | 29 |
| Nebraska | 31.8% | 262,175 homes | 1.2 pp | 824,012 | ±7,420 | 26 |
| Nevada | 33.0% | 409,239 homes | -3.1 pp | 1,238,925 | ±12,333 | 24 |
| New Hampshire | 11.9% | 68,090 homes | 2.0 pp | 570,689 | ±4,222 | 49 |
| New Jersey | 16.7% | 592,186 homes | 3.1 pp | 3,543,944 | ±12,665 | 42 |
| New Mexico | 22.5% | 192,892 homes | -0.1 pp | 856,970 | ±6,302 | 36 |
| New York | 16.5% | 1,292,868 homes | 4.3 pp | 7,828,074 | ±19,649 | 44 |
| North Carolina | 66.0% | 2,966,699 homes | 1.7 pp | 4,496,359 | ±22,363 | 4 |
| North Dakota | 41.0% | 143,327 homes | -0.3 pp | 349,705 | ±4,819 | 20 |
| Ohio | 26.5% | 1,307,559 homes | 1.8 pp | 4,929,322 | ±17,699 | 31 |
| Oklahoma | 41.9% | 671,928 homes | 2.4 pp | 1,603,748 | ±8,773 | 19 |
| Oregon | 54.0% | 941,491 homes | 1.5 pp | 1,744,270 | ±12,108 | 15 |
| Pennsylvania | 26.0% | 1,396,275 homes | 2.2 pp | 5,361,724 | ±16,107 | 32 |
| Rhode Island | 14.2% | 63,619 homes | 3.9 pp | 448,318 | ±4,371 | 46 |
| South Carolina | 69.7% | 1,548,377 homes | -1.2 pp | 2,222,890 | ±15,183 | 2 |
| South Dakota | 31.6% | 120,936 homes | -0.9 pp | 382,302 | ±4,403 | 27 |
| Tennessee | 64.6% | 1,891,350 homes | 2.0 pp | 2,928,765 | ±18,368 | 5 |
| Texas | 60.5% | 6,929,859 homes | -0.6 pp | 11,449,769 | ±36,436 | 7 |
| Utah | 16.7% | 197,314 homes | 1.8 pp | 1,184,428 | ±6,988 | 43 |
| Vermont | 11.8% | 33,651 homes | 5.4 pp | 285,548 | ±3,066 | 50 |
| Virginia | 57.7% | 1,990,503 homes | 1.5 pp | 3,449,307 | ±19,006 | 11 |
| Washington | 60.0% | 1,902,153 homes | 3.7 pp | 3,168,080 | ±15,535 | 8 |
| West Virginia | 48.2% | 356,767 homes | 3.1 pp | 740,840 | ±6,293 | 16 |
| Wisconsin | 18.3% | 464,872 homes | 2.2 pp | 2,535,198 | ±10,645 | 41 |
| Wyoming | 24.2% | 61,941 homes | 1.4 pp | 256,289 | ±3,781 | 35 |
Download every source observation as CSV ↓ · Explorer data (JSON)
The primary fuel used in occupied homes
ACS table B25040 asks which fuel is used most for heating the occupied home. Each home falls into exactly one reported category. Utility gas is predominantly natural gas; bottled or tank gas includes propane and butane. Fuel oil includes kerosene. The universe includes owner-occupied and renter-occupied homes; vacant homes are excluded. A secondary wood stove does not necessarily make a home a wood-heated home.
Shares, counts and percentage-point changes
Fuel share = homes reporting the selected primary fuel ÷ occupied housing units × 100. Counts show homes, not people. Change subtracts the share in the comparison year from the selected-year share, in percentage points. For example, moving from 10% to 12% is a 2-point increase. Comparing a year with itself returns zero; a comparison year later than the selected year is reset to the selected year.
What a changing fuel mix can establish
A change in statewide shares describes two survey populations, not tracked conversions by individual households. Construction, demolition, migration and sampling can affect the mix. Electricity includes both resistance heating and electric heat pumps; this table cannot measure heat-pump adoption separately. The shares also do not estimate heating bills, equipment efficiency or savings from switching fuels.
Source years and uncertainty
The snapshot uses standard ACS 1-year estimates for 2019 and 2021–2024, with no standard 2020 estimate inserted. The historical chart leaves that year out of the observations; no value is interpolated. Published 90% margins of error for the selected fuel count are shown. Derived-share and change margins are unavailable, so small rank differences should not be interpreted as statistically established. All fuel counts reconcile to occupied housing units in every state-year.
Source and reproducibility
U.S. Census Bureau · ACS 1-year. Sources retrieved October 1, 2026. The snapshot stays fixed until a reviewed data refresh; this page does not claim live data.
Archived source files, selection rules and SHA-256 checksums.
Common questions
Does electricity mean heat pumps?
No. ACS combines heat pumps and other electric heating in the electricity category.
Can I compare heating-oil or propane markets?
Select the fuel to compare the observed home counts, shares and changes. These figures describe primary home heating, not all uses of the fuel.