Free local comparison · no account needed
Household Income Percentile in San Bernardino County, CA
Compare your household income with your county, state and the United States.
Gross household income · 2024 dollars · estimates from published brackets
Explore the map and calculator ↓Loading interactive controls. The saved example and source data are available below.
Saved example: $80,000 gross household income · 2024 dollars. Change the inputs to calculate your own comparison.
58 points shown; 58 places in this view. Dot colors run from lower teal values to higher rust values; gray means unavailable. Exact values follow in the table.
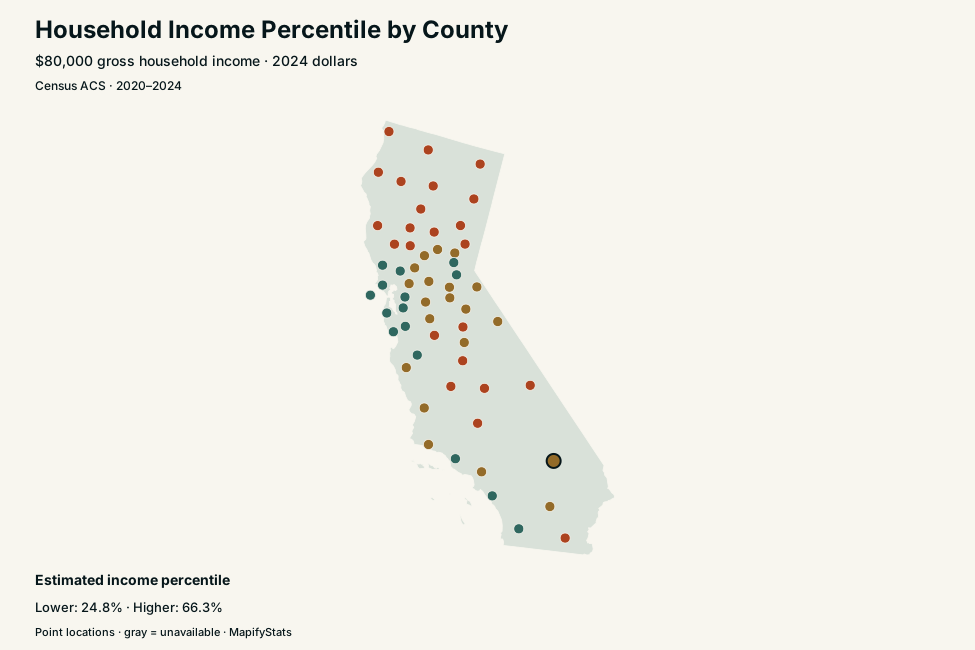
San Bernardino County, CA
$80,000 gross household income · 2024 dollars
46.6% estimated percentile
Published income brackets place this income between the 43.9% and 57.4% cumulative household shares. The point estimate assumes incomes are spread evenly within this bracket. This range is a bracket bound, not a confidence interval.
| Geography | Estimated percentile | Bracket bounds |
|---|---|---|
| San Bernardino County, CA | 46.6% estimated percentile | 43.9%–57.4% |
| California | 41.1% estimated percentile | 38.8%–50.4% |
| United States | 49.4% estimated percentile | 46.9%–59.5% |
Household income distribution
| Annual income bracket | Households | Share | Count margin of error |
|---|---|---|---|
| Under $10,000 (including losses) | 28,965 | 4.3% | ±1,575 |
| $10,000–$14,999 | 20,487 | 3.0% | ±1,295 |
| $15,000–$19,999 | 17,038 | 2.5% | ±1,346 |
| $20,000–$24,999 | 20,641 | 3.1% | ±1,266 |
| $25,000–$29,999 | 20,896 | 3.1% | ±1,545 |
| $30,000–$34,999 | 20,287 | 3.0% | ±1,249 |
| $35,000–$39,999 | 23,264 | 3.4% | ±1,401 |
| $40,000–$44,999 | 21,424 | 3.2% | ±1,258 |
| $45,000–$49,999 | 21,683 | 3.2% | ±1,397 |
| $50,000–$59,999 | 39,176 | 5.8% | ±1,734 |
| $60,000–$74,999 | 62,314 | 9.2% | ±2,292 |
| $75,000–$99,999 | 90,983 | 13.5% | ±2,746 |
| $100,000–$124,999 | 75,603 | 11.2% | ±2,201 |
| $125,000–$149,999 | 55,950 | 8.3% | ±1,903 |
| $150,000–$199,999 | 76,610 | 11.4% | ±2,346 |
| $200,000 or more | 79,594 | 11.8% | ±2,418 |
Compare places in this state
20 of 58 places shown in the saved example. Interactive controls can search every place in the dataset.
Scroll the table horizontally to see every column →
| Place | Estimated income percentile | Households | Bracket bounds |
|---|---|---|---|
| Alameda County, CA | 32.4% | 598,246 | 30.6%–40.0% |
| Alpine County, CA | 40.9% | 435 | 40.0%–44.6% |
| Amador County, CA | 45.7% | 16,091 | 42.6%–58.2% |
| Butte County, CA | 56.3% | 83,312 | 53.8%–66.0% |
| Calaveras County, CA | 51.1% | 18,437 | 48.7%–60.5% |
| Colusa County, CA | 53.1% | 7,512 | 49.6%–67.1% |
| Contra Costa County, CA | 31.5% | 414,417 | 29.5%–39.8% |
| Del Norte County, CA | 56.3% | 9,522 | 53.9%–66.0% |
| El Dorado County, CA | 37.0% | 76,185 | 34.7%–46.2% |
| Fresno County, CA | 53.1% | 324,702 | 50.5%–63.4% |
| Glenn County, CA | 58.3% | 9,810 | 55.9%–68.2% |
| Humboldt County, CA | 61.6% | 54,922 | 59.4%–70.5% |
| Imperial County, CA | 63.1% | 49,644 | 60.8%–72.1% |
| Inyo County, CA | 53.4% | 8,040 | 50.8%–63.8% |
| Kern County, CA | 55.5% | 284,931 | 53.0%–65.4% |
| Kings County, CA | 55.7% | 44,052 | 53.0%–66.5% |
| Lake County, CA | 62.4% | 26,940 | 60.5%–70.0% |
| Lassen County, CA | 57.6% | 9,247 | 54.8%–68.8% |
| Los Angeles County, CA | 45.1% | 3,416,449 | 42.7%–54.6% |
| Madera County, CA | 52.0% | 45,379 | 49.1%–64.0% |
Find a local guide
Local guides cover fifty of the largest counties by household count, plus Wake and Durham counties. The calculator covers every current U.S. county equivalent.
Browse 51 local guides
How the percentile estimate works
ACS table B19001 counts households in sixteen income brackets. We sum brackets below your income and interpolate uniformly within bounded brackets. Income below $10,000 (including losses) or at or above $200,000 falls in an open-ended bracket: only cumulative bracket bounds can be reported. Inputs must be nonnegative. Household income combines the income of household members; a personal salary alone may not describe the household.
Coverage, dollars and uncertainty
The 2020–2024 five-year estimates cover 3,144 county equivalents, all 50 states and DC. Income is expressed in 2024 inflation-adjusted dollars. Enter a comparable household amount; this calculator does not automatically adjust a current salary for inflation. Published count margins of error are shown at 90% confidence. A derived percentile margin of error is unavailable. Nearby estimates should not be interpreted as statistically different solely because of their ranking.
Sources and reproducibility
Census ACS 2024 five-year summary files. Public files retrieved October 1, 2026. These snapshots stay fixed until a reviewed refresh. County points use Census 2024 Gazetteer internal points; metro points are the average of matched county coordinates.
Original download links, archived extract rules and SHA-256 checksums. Missing or suppressed values remain unavailable in maps, tables and downloads. Maps use point locations rather than geographic area to represent counties, metros and stations; dots may overlap at the national scale.
Common questions
Can I get an exact income percentile for my county?
No. Public bracket counts support an approximate percentile and bracket bounds, not an exact income ranking. Both open-ended brackets, under $10,000 and $200,000 or more, have no point estimate.
Does this compare individuals or households?
Households. Combine the relevant annual gross household income before comparing it with the published household distribution.