Free local comparison · no account needed
New Orleans, LA Climate: Hot Days, Rain & Snow
Compare heat, freezing nights, rainfall and snowfall across selected U.S. cities.
Representative weather stations · 30-year historical averages · annual and monthly views
Explore the map and calculator ↓Loading interactive controls. The saved example and source data are available below.
Saved example: Annual totals · 1991–2020 normals. Change the inputs to calculate your own comparison.
60 points shown; 60 places in this view. Dot colors run from lower teal values to higher rust values; gray means unavailable. Exact values follow in the table.
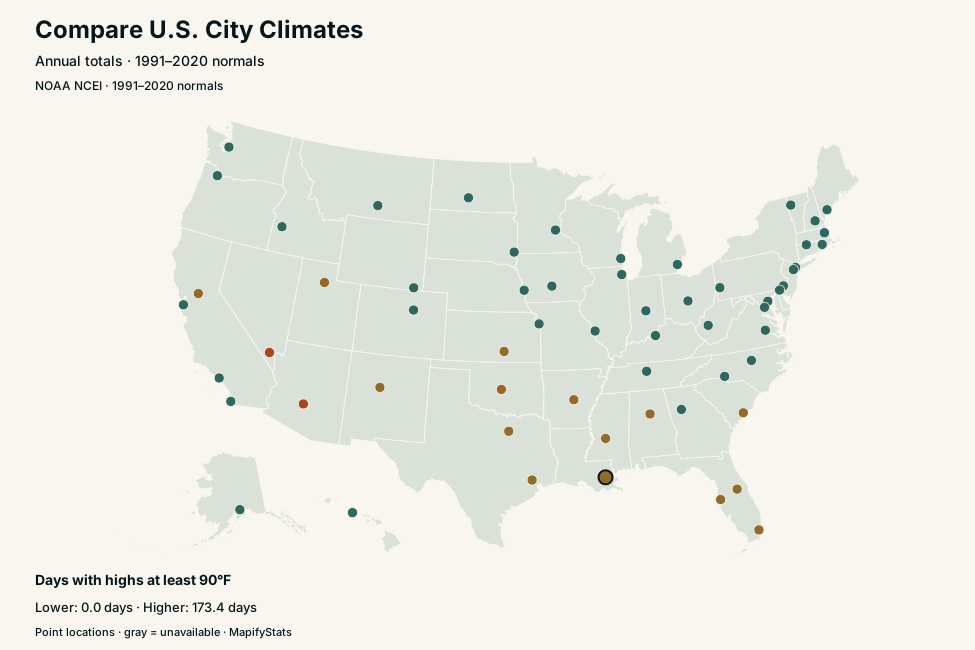
New Orleans, LA
Annual totals · 1991–2020 normals
- Days with highs at least 90°F
- 85.2 days
- Nights with lows at or below 32°F
- 5.4 nights
- Precipitation, including snow water equivalent
- 63.3 in
- Snowfall
- 0.0 in
Station: NEW ORLEANS INTL AP, LA US (USW00012916). Airport and station conditions can differ from individual neighborhoods.
| Climate measure | New Orleans, LA | Seattle, WA | First minus second |
|---|---|---|---|
| Days with highs at least 90°F | 85.2 days | 3.8 days | 81.4 days |
| Nights with lows at or below 32°F | 5.4 nights | 25.2 nights | -19.8 nights |
| Precipitation, including snow water equivalent | 63.3 in | 39.3 in | 24.0 in |
| Snowfall | 0.0 in | 6.3 in | -6.3 in |
Comparison station: SEATTLE TACOMA INTL AP, WA US (USW00024233), station state WA.
Days with highs at least 90°F: New Orleans and Seattle
Teal: New Orleans · ochre: Seattle. The monthly values follow below.
| Month | New Orleans, LA | Seattle, WA |
|---|---|---|
| January | 0.0 days | 0.0 days |
| February | 0.0 days | 0.0 days |
| March | 0.0 days | 0.0 days |
| April | 0.2 days | 0.0 days |
| May | 5.9 days | 0.0 days |
| June | 18.4 days | 0.6 days |
| July | 22.9 days | 1.8 days |
| August | 23.0 days | 1.2 days |
| September | 12.8 days | 0.2 days |
| October | 2.0 days | 0.0 days |
| November | 0.0 days | 0.0 days |
| December | 0.0 days | 0.0 days |
Selected-period difference (first city minus second): 81.4 days. Annual values sum the twelve monthly normals; rounding can differ from NOAA's separately published annual product.
Compare places in this state
20 of 60 places shown in the saved example. Interactive controls can search every place in the dataset.
Scroll the table horizontally to see every column →
| Place | Days with highs at least 90°F |
|---|---|
| Albuquerque, NM | 64.4 days |
| Anchorage, AK | 0.0 days |
| Atlanta, GA | 47.2 days |
| Baltimore, MD | 33.8 days |
| Billings, MT | 32.1 days |
| Birmingham, AL | 65.1 days |
| Bismarck, ND | 20.5 days |
| Boise, ID | 54.8 days |
| Boston, MA | 14.1 days |
| Burlington, VT | 8.1 days |
| Charleston, SC | 64.3 days |
| Charleston, WV | 23.5 days |
| Charlotte, NC | 49.3 days |
| Cheyenne, WY | 14.9 days |
| Chicago, IL | 16.7 days |
| Columbus, OH | 20.7 days |
| Concord, NH | 13.7 days |
| Dallas, TX | 106.3 days |
| Denver, CO | 46.2 days |
| Des Moines, IA | 22.0 days |
Find a local guide
Every city in this launch has its own station and monthly comparison.
Browse 60 local guides
Compare the weather you experience
The selected stations supply average monthly counts of days with maximum temperatures at least 90°F and nights with minimum temperatures at or below 32°F. Precipitation is measured in inches of liquid water, including the water equivalent of snowfall. Snowfall is measured separately in inches of snow. Annual views sum the twelve published monthly normals, retaining decimals. If any month is missing, an annual total is unavailable.
Stations and historical averages
This launch covers 60 selected cities with representative airport or city weather stations across all 50 states and DC. It is not a census of every U.S. city. Normals describe the 1991–2020 period, not this year's weather or a climate forecast. Elevation, distance from the airport and neighborhood conditions matter. The station name and location are shown for each city; Washington, DC is represented by Reagan National Airport in Virginia. NOAA completeness, measurement and year flags remain in the archived data.
Sources and reproducibility
NOAA NCEI 1991–2020 U.S. Climate Normals. Public files retrieved October 1, 2026. These snapshots stay fixed until a reviewed refresh. County points use Census 2024 Gazetteer internal points; metro points are the average of matched county coordinates.
Original download links, archived extract rules and SHA-256 checksums. Missing or suppressed values remain unavailable in maps, tables and downloads. Maps use point locations rather than geographic area to represent counties, metros and stations; dots may overlap at the national scale.
Common questions
Which city has fewer hot days or freezing nights?
Select two cities and the relevant metric. The comparison shows their monthly normals and the difference over the selected month or whole year.
Does precipitation mean only rain?
No. NOAA precipitation includes liquid water from rain and the water equivalent of snow. The separate snowfall metric reports inches of snow.