U.S. Bureau of Labor Statistics · BED
Business Survival Rates by State
Follow establishments opened in the same year, and see how many still reported employment years later.
BLS employer establishments · observations through March 2025
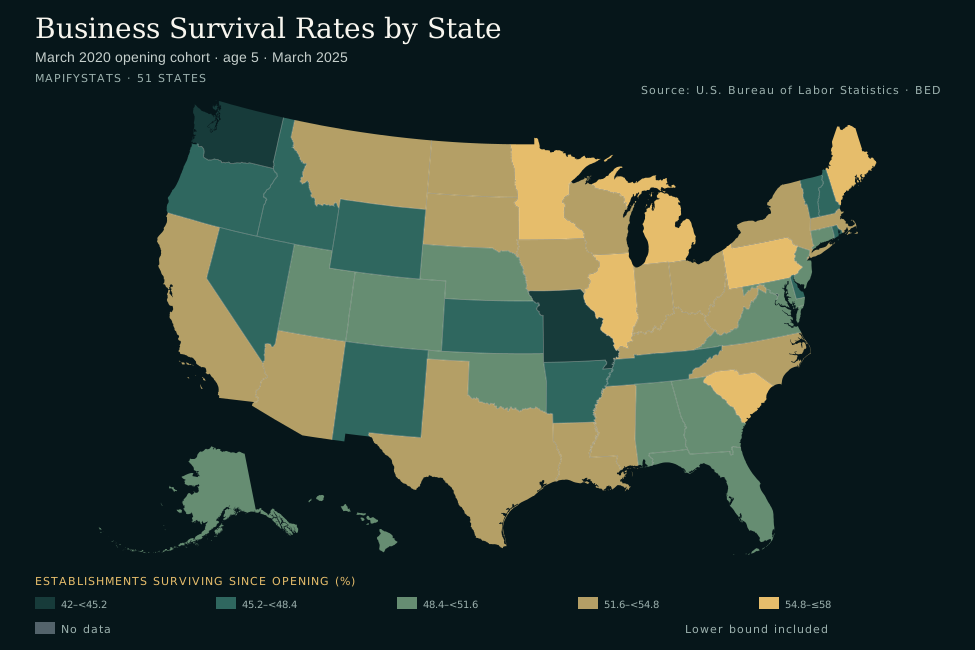
Explore every state ↓March 2020 opening cohort · age 5 · March 2025
- 42–<45.2
- 45.2–<48.4
- 48.4–<51.6
- 51.6–<54.8
- 54.8–≤58
- No data
- Lower bound included
State estimates and source notes are available below. Enable JavaScript for interactive comparisons.
Compare two states
Historical comparison
Scroll the chart horizontally to see the full period →
View chart values as a table
All 50 states and DC
Pennsylvania has the highest selected point estimate (57.1%); Washington has the lowest (42.2%).
March 2020 opening cohort · age 5 · March 2025
Scroll horizontally to see every column →
| Alabama | 51.4% | 8,908 | 4,580 | 24 |
|---|---|---|---|---|
| Alaska | 50.8% | 1,277 | 649 | 28 |
| Arizona | 52.1% | 13,685 | 7,133 | 22 |
| Arkansas | 48.0% | 6,153 | 2,951 | 39 |
| California | 53.7% | 142,133 | 76,308 | 12 |
| Colorado | 48.5% | 18,478 | 8,960 | 36 |
| Connecticut | 51.1% | 7,828 | 4,001 | 25 |
| Delaware | 48.1% | 2,583 | 1,242 | 37 |
| District of Columbia | 42.4% | 3,621 | 1,536 | Unranked |
| Florida | 49.5% | 64,451 | 31,912 | 34 |
| Georgia | 49.9% | 24,232 | 12,089 | 32 |
| Hawaii | 51.0% | 2,719 | 1,386 | 26 |
| Idaho | 45.6% | 6,537 | 2,978 | 48 |
| Illinois | 55.6% | 20,261 | 11,256 | 3 |
| Indiana | 54.3% | 10,082 | 5,471 | 9 |
| Iowa | 53.7% | 6,130 | 3,291 | 12 |
| Kansas | 47.4% | 5,804 | 2,753 | 43 |
| Kentucky | 54.1% | 7,961 | 4,305 | 11 |
| Louisiana | 52.9% | 7,245 | 3,834 | 17 |
| Maine | 54.9% | 3,243 | 1,781 | 5 |
| Maryland | 50.1% | 10,757 | 5,393 | 31 |
| Massachusetts | 52.7% | 18,136 | 9,557 | 18 |
| Michigan | 55.0% | 16,031 | 8,815 | 4 |
| Minnesota | 54.9% | 9,685 | 5,313 | 5 |
| Mississippi | 53.5% | 3,966 | 2,120 | 15 |
| Missouri | 42.9% | 17,768 | 7,618 | 49 |
| Montana | 53.0% | 3,539 | 1,874 | 16 |
| Nebraska | 50.9% | 4,648 | 2,364 | 27 |
| Nevada | 47.6% | 8,350 | 3,975 | 41 |
| New Hampshire | 47.7% | 4,083 | 1,948 | 40 |
| New Jersey | 50.5% | 27,130 | 13,697 | 29 |
| New Mexico | 46.3% | 4,531 | 2,097 | 46 |
| New York | 51.9% | 39,833 | 20,664 | 23 |
| North Carolina | 54.2% | 20,736 | 11,234 | 10 |
| North Dakota | 54.4% | 1,876 | 1,020 | 7 |
| Ohio | 54.4% | 17,578 | 9,564 | 7 |
| Oklahoma | 50.2% | 7,745 | 3,886 | 30 |
| Oregon | 45.8% | 11,037 | 5,055 | 47 |
| Pennsylvania | 57.1% | 21,339 | 12,178 | 1 |
| Rhode Island | 48.1% | 2,939 | 1,413 | 37 |
| South Carolina | 55.9% | 11,535 | 6,443 | 2 |
| South Dakota | 52.7% | 2,236 | 1,178 | 18 |
| Tennessee | 46.4% | 14,614 | 6,778 | 45 |
| Texas | 52.5% | 57,777 | 30,314 | 20 |
| Utah | 49.7% | 9,901 | 4,918 | 33 |
| Vermont | 46.6% | 1,407 | 656 | 44 |
| Virginia | 48.8% | 20,074 | 9,805 | 35 |
| Washington | 42.2% | 18,593 | 7,844 | 50 |
| West Virginia | 53.6% | 3,082 | 1,653 | 14 |
| Wisconsin | 52.4% | 11,391 | 5,973 | 21 |
| Wyoming | 47.5% | 1,950 | 926 | 42 |
Download every source observation as CSV ↓ · Explorer data (JSON)
Follow one opening cohort
An opening cohort groups establishments that first reported employment during the year ending in March of the selected year. The five-year view of the 2020 cohort observes survival through March 2025. Changing the opening year changes the economic conditions the cohort experienced; comparing ages within one cohort differs from comparing five-year outcomes across cohorts.
Establishments are not companies
BLS Business Employment Dynamics follows private-sector employer establishments, generally individual business locations, using unemployment-insurance employment records. A company may operate multiple establishments. This data does not describe every nonemployer business, new LLC registration or venture-backed startup. Remaining in the employment records is the relevant measure of survival.
A closure is not necessarily a failure
An establishment can disappear from the records for reasons other than financial failure. The complement of the survival rate should not be labeled as a bankruptcy rate. A high survival rate alone also does not prove a state is the best place to start a business; entry rates, industry mix and local demand can differ.
Methodology and coverage
The explorer archives BLS state Table 7, total private sector, for opening cohorts 2010–2025, with observations through March 2025. The map offers one-, three-, five- and ten-year outcomes only where the cohort has reached that age; newer cohorts cannot have an observed ten-year outcome. The trend chart includes opening age zero and all available annual observations. Rates use the published one-decimal precision rather than recalculating rounded rates. Suppressed or unavailable values remain unavailable. DC is included but unranked.
Source and reproducibility
U.S. Bureau of Labor Statistics · BED. Sources retrieved October 1, 2026. The snapshot stays fixed until a reviewed data refresh; this page does not claim live data.
Archived source files, selection rules and SHA-256 checksums.
Common questions
Can I see survival by state and industry together?
This explorer uses each state's total private sector. It does not manufacture state-by-industry rates from separate national industry totals.
Why are some ages unavailable for newer cohorts?
The source ends in March 2025. Outcomes beyond the observed cohort age have not happened in this dataset.