
MAPIFYSTATS / ANIMATED MAPS / 01
District of Columbia: Human Rivers
Where Americans move, one year at a time. Follow state-to-state tax-return migration, separate incoming and outgoing moves, and compare households, people proxies and reported income.
Source: IRS SOI state migration; U.S. Census Bureau Vintage 2024 population estimates and 2024 Gazetteer. · Source release, rights & limitations
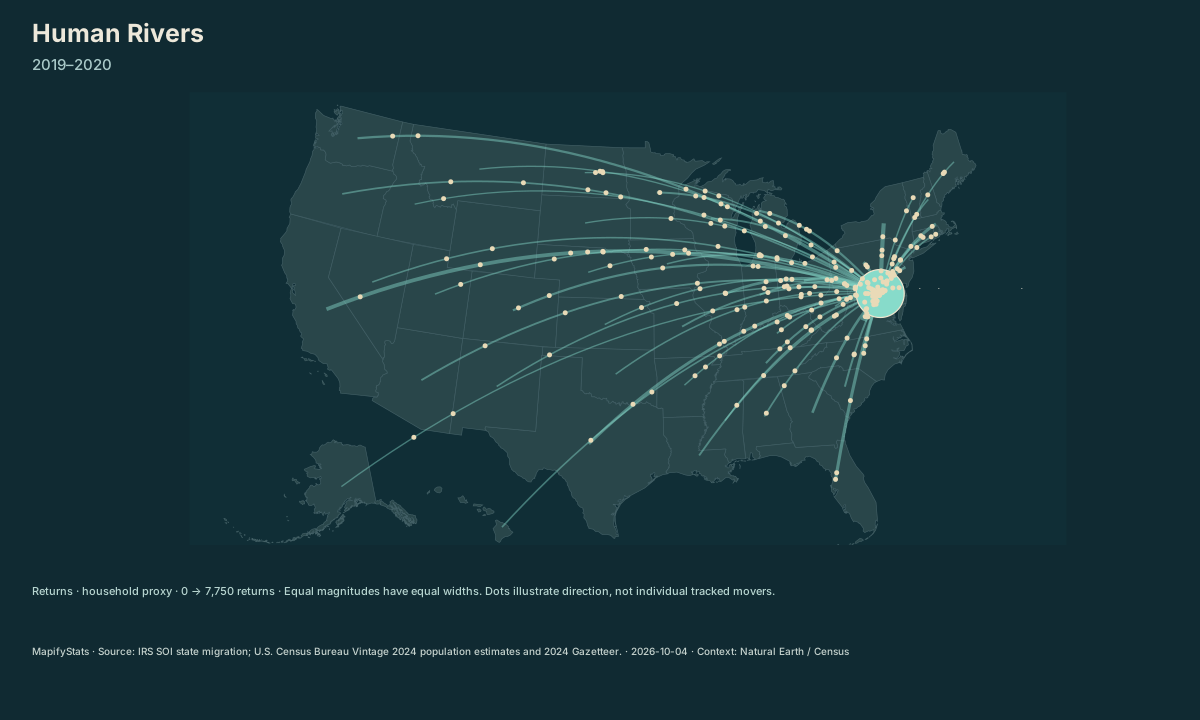
District of Columbia: 27,909 returns reported into the state in 2019–2020. Largest reported connection: Maryland (7,750). 1 connections are unknown.
| Place / record | Value | Definition |
|---|---|---|
| Maryland | 7,750 returns | |
| Virginia | 5,802 returns | |
| New York | 2,153 returns | |
| California | 1,653 returns | |
| Florida | 989 returns | |
| Massachusetts | 885 returns | |
| Pennsylvania | 853 returns | |
| Texas | 752 returns | |
| North Carolina | 690 returns | |
| Illinois | 623 returns | |
| New Jersey | 605 returns | |
| Georgia | 557 returns | |
| Ohio | 376 returns | |
| Washington | 342 returns | |
| Michigan | 316 returns | |
| Connecticut | 315 returns | |
| Colorado | 307 returns | |
| Tennessee | 227 returns | |
| South Carolina | 207 returns | |
| Minnesota | 199 returns | |
| Indiana | 179 returns | |
| Louisiana | 169 returns | |
| Missouri | 163 returns | |
| Wisconsin | 160 returns | |
| Arizona | 158 returns | |
| Oregon | 116 returns | |
| Alabama | 115 returns | |
| Delaware | 101 returns | |
| Kentucky | 97 returns | |
| Hawaii | 85 returns | |
| Rhode Island | 82 returns | |
| New Hampshire | 78 returns | |
| Nevada | 74 returns | |
| New Mexico | 69 returns | |
| West Virginia | 65 returns | |
| Oklahoma | 64 returns | |
| Iowa | 62 returns | |
| Kansas | 56 returns | |
| Utah | 56 returns | |
| Vermont | 55 returns | |
| Mississippi | 52 returns | |
| Maine | 46 returns | |
| Nebraska | 42 returns | |
| Arkansas | 41 returns | |
| Alaska | 32 returns | |
| South Dakota | 26 returns | |
| Montana | 25 returns | |
| Idaho | 20 returns | |
| North Dakota | 20 returns | |
| Wyoming | Unavailable returns |
The opening frame and source values work without JavaScript. Enable JavaScript to play, select places, compare or export.
Source: IRS SOI state migration; U.S. Census Bureau Vintage 2024 population estimates and 2024 Gazetteer. · Source release, rights & limitations
Florida's incoming streams and outgoing streams describe different groups of matched tax returns. Switch direction to see both.
Source: IRS SOI state migration; U.S. Census Bureau Vintage 2024 population estimates and 2024 Gazetteer. · Source release, rights & limitations
Synchronized comparison
Both maps share replay progress and geographic scale. Source periods appear in each title.
What the map shows
District of Columbia: 27,909 returns reported into the state in 2019–2020. Largest reported connection: Maryland (7,750). 1 connections are unknown.
Drag to explore; manual map movement releases guided following. Particle movement and travel progress are illustrative. Attribution stays with every exported image.
Share this replay
Links include your selected public places, time, camera and exact source version. Review your selections before sharing.
Browser video recording is best effort, at 12 fps. A poster remains available when video capture is unsupported.
Accessible source values
| Place / record | Value | Definition |
|---|---|---|
| Maryland | 7,750 returns | |
| Virginia | 5,802 returns | |
| New York | 2,153 returns | |
| California | 1,653 returns | |
| Florida | 989 returns | |
| Massachusetts | 885 returns | |
| Pennsylvania | 853 returns | |
| Texas | 752 returns | |
| North Carolina | 690 returns | |
| Illinois | 623 returns | |
| New Jersey | 605 returns | |
| Georgia | 557 returns | |
| Ohio | 376 returns | |
| Washington | 342 returns | |
| Michigan | 316 returns | |
| Connecticut | 315 returns | |
| Colorado | 307 returns | |
| Tennessee | 227 returns | |
| South Carolina | 207 returns | |
| Minnesota | 199 returns | |
| Indiana | 179 returns | |
| Louisiana | 169 returns | |
| Missouri | 163 returns | |
| Wisconsin | 160 returns | |
| Arizona | 158 returns | |
| Oregon | 116 returns | |
| Alabama | 115 returns | |
| Delaware | 101 returns | |
| Kentucky | 97 returns | |
| Hawaii | 85 returns | |
| Rhode Island | 82 returns | |
| New Hampshire | 78 returns | |
| Nevada | 74 returns | |
| New Mexico | 69 returns | |
| West Virginia | 65 returns | |
| Oklahoma | 64 returns | |
| Iowa | 62 returns | |
| Kansas | 56 returns | |
| Utah | 56 returns | |
| Vermont | 55 returns | |
| Mississippi | 52 returns | |
| Maine | 46 returns | |
| Nebraska | 42 returns | |
| Arkansas | 41 returns | |
| Alaska | 32 returns | |
| South Dakota | 26 returns | |
| Montana | 25 returns | |
| Idaho | 20 returns | |
| North Dakota | 20 returns | |
| Wyoming | Unavailable returns |
Accessible comparison values
Sources, rights & limitations
Source: IRS SOI state migration; U.S. Census Bureau Vintage 2024 population estimates and 2024 Gazetteer. Basemap: Natural Earth (public domain), U.S. Census Bureau/us-atlas (public domain). Ancient Earth uses the reconstructed source-model land instead.
Data release: 2026-10-04. Retrieved 2026-10-04T00:00:00Z. Commercial use: approved. Export rights: approved.
- https://www2.census.gov/geo/docs/maps-data/data/gazetteer/2024_Gazetteer/2024_Gaz_state_national.zip
- https://www2.census.gov/programs-surveys/popest/datasets/2020-2024/state/totals/NST-EST2024-ALLDATA.csv
- https://www.irs.gov/pub/irs-soi/stateoutflow1920.csv
- https://www.irs.gov/pub/irs-soi/stateinflow1920.csv
- https://www.irs.gov/pub/irs-soi/stateoutflow2021.csv
- https://www.irs.gov/pub/irs-soi/stateinflow2021.csv
- https://www.irs.gov/pub/irs-soi/stateoutflow2122.csv
- https://www.irs.gov/pub/irs-soi/stateinflow2122.csv
- https://www.irs.gov/pub/irs-soi/stateoutflow2223.csv
- https://www.irs.gov/pub/irs-soi/stateinflow2223.csv
License: https://www.irs.gov/about-irs/use-of-content-from-irsgov
- These are filing-year address changes on matched tax returns, not a complete census of movers. Mailing addresses may differ from residences.
- Returns approximate households; exemptions/individuals approximate people. AGI is year-2 reported adjusted gross income, includes deficits, and is not wealth or money transported.
- Bilateral streams use outflow records once. Inflow and outflow AGI can differ by $1,000 due to source rounding; published direction totals retain their own values.
- Suppressed (-1) and absent bilateral cells remain unknown. The 2022–2023 archive omits six bilateral cells. Published totals are not permission to infer their values.
- 2019–2020 through 2021–2022 use the prior matching series. 2022–2023 is a new series: enhanced matching adds about 5% of returns, and disclosure procedures changed; do not interpret that break as migration growth.
- Per-capita figures divide by the selected state's July 1 population in the destination filing year from Census Vintage 2024, per 10,000 residents. They compare tax-record flows with all residents and are not the percentage of residents who moved.
- Foreign flows, same-state county moves and nonmigrants are separate source categories and are excluded from the state-to-state streams. Curves are illustrative, not travel routes.
Units: returns: matched returns (household proxy) · exemptions: reported individuals (people proxy) · agi: nominal USD, year-2 reported AGI · population: residents, July 1, Census Vintage 2024.
Immutable manifest and asset checksums · Download normalized source scene