
MAPIFYSTATS / ANIMATED MAPS / 04
West Virginia · state: The Housing Roller Coaster
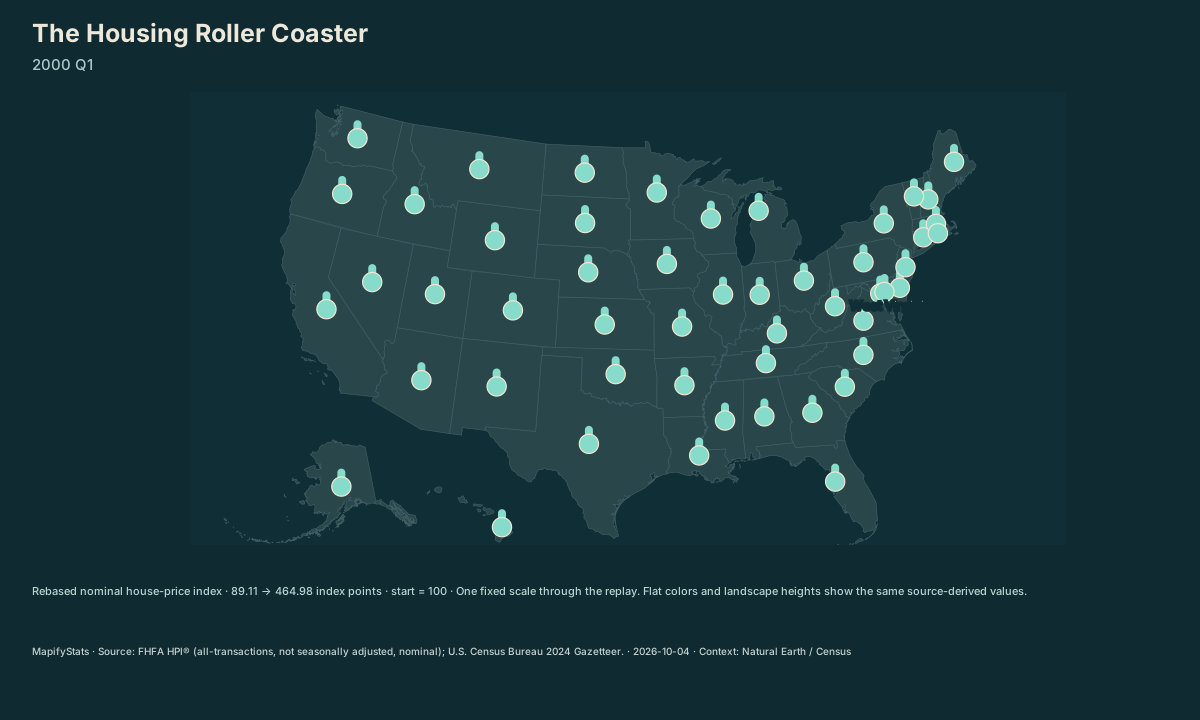
Every market has a different climb. Compare nominal FHFA housing-price index histories from a selected starting quarter, with a flat-map alternative and exact rebased values.
Source: FHFA HPI® (all-transactions, not seasonally adjusted, nominal); U.S. Census Bureau 2024 Gazetteer. · Source release, rights & limitations
West Virginia: rebased index 100 in 2000 Q1; 0% nominal change since 2000 Q1.
| Place / record | Value | Definition |
|---|---|---|
| Alabama | 100 index points · start = 100 | |
| Alaska | 100 index points · start = 100 | |
| Arizona | 100 index points · start = 100 | |
| Arkansas | 100 index points · start = 100 | |
| California | 100 index points · start = 100 | |
| Colorado | 100 index points · start = 100 | |
| Connecticut | 100 index points · start = 100 | |
| Delaware | 100 index points · start = 100 | |
| District of Columbia | 100 index points · start = 100 | |
| Florida | 100 index points · start = 100 | |
| Georgia | 100 index points · start = 100 | |
| Hawaii | 100 index points · start = 100 | |
| Idaho | 100 index points · start = 100 | |
| Illinois | 100 index points · start = 100 | |
| Indiana | 100 index points · start = 100 | |
| Iowa | 100 index points · start = 100 | |
| Kansas | 100 index points · start = 100 | |
| Kentucky | 100 index points · start = 100 | |
| Louisiana | 100 index points · start = 100 | |
| Maine | 100 index points · start = 100 | |
| Maryland | 100 index points · start = 100 | |
| Massachusetts | 100 index points · start = 100 | |
| Michigan | 100 index points · start = 100 | |
| Minnesota | 100 index points · start = 100 | |
| Mississippi | 100 index points · start = 100 | |
| Missouri | 100 index points · start = 100 | |
| Montana | 100 index points · start = 100 | |
| Nebraska | 100 index points · start = 100 | |
| Nevada | 100 index points · start = 100 | |
| New Hampshire | 100 index points · start = 100 | |
| New Jersey | 100 index points · start = 100 | |
| New Mexico | 100 index points · start = 100 | |
| New York | 100 index points · start = 100 | |
| North Carolina | 100 index points · start = 100 | |
| North Dakota | 100 index points · start = 100 | |
| Ohio | 100 index points · start = 100 | |
| Oklahoma | 100 index points · start = 100 | |
| Oregon | 100 index points · start = 100 | |
| Pennsylvania | 100 index points · start = 100 | |
| Rhode Island | 100 index points · start = 100 | |
| South Carolina | 100 index points · start = 100 | |
| South Dakota | 100 index points · start = 100 | |
| Tennessee | 100 index points · start = 100 | |
| Texas | 100 index points · start = 100 | |
| Utah | 100 index points · start = 100 | |
| Vermont | 100 index points · start = 100 | |
| Virginia | 100 index points · start = 100 | |
| Washington | 100 index points · start = 100 | |
| West Virginia | 100 index points · start = 100 | |
| Wisconsin | 100 index points · start = 100 | |
| Wyoming | 100 index points · start = 100 |
The opening frame and source values work without JavaScript. Enable JavaScript to play, select places, compare or export.
Source: FHFA HPI® (all-transactions, not seasonally adjusted, nominal); U.S. Census Bureau 2024 Gazetteer. · Source release, rights & limitations
Choose a starting year. Each market begins at the same rebased index so its change can be compared, without treating index points as house prices.
Source: FHFA HPI® (all-transactions, not seasonally adjusted, nominal); U.S. Census Bureau 2024 Gazetteer. · Source release, rights & limitations
Synchronized comparison
Both maps share replay progress and geographic scale. Source periods appear in each title.
What the map shows
West Virginia: rebased index 100 in 2000 Q1; 0% nominal change since 2000 Q1.
Drag to explore; manual map movement releases guided following. Particle movement and travel progress are illustrative. Attribution stays with every exported image.
Share this replay
Links include your selected public places, time, camera and exact source version. Review your selections before sharing.
Browser video recording is best effort, at 12 fps. A poster remains available when video capture is unsupported.
Accessible source values
| Place / record | Value | Definition |
|---|---|---|
| Alabama | 100 index points · start = 100 | |
| Alaska | 100 index points · start = 100 | |
| Arizona | 100 index points · start = 100 | |
| Arkansas | 100 index points · start = 100 | |
| California | 100 index points · start = 100 | |
| Colorado | 100 index points · start = 100 | |
| Connecticut | 100 index points · start = 100 | |
| Delaware | 100 index points · start = 100 | |
| District of Columbia | 100 index points · start = 100 | |
| Florida | 100 index points · start = 100 | |
| Georgia | 100 index points · start = 100 | |
| Hawaii | 100 index points · start = 100 | |
| Idaho | 100 index points · start = 100 | |
| Illinois | 100 index points · start = 100 | |
| Indiana | 100 index points · start = 100 | |
| Iowa | 100 index points · start = 100 | |
| Kansas | 100 index points · start = 100 | |
| Kentucky | 100 index points · start = 100 | |
| Louisiana | 100 index points · start = 100 | |
| Maine | 100 index points · start = 100 | |
| Maryland | 100 index points · start = 100 | |
| Massachusetts | 100 index points · start = 100 | |
| Michigan | 100 index points · start = 100 | |
| Minnesota | 100 index points · start = 100 | |
| Mississippi | 100 index points · start = 100 | |
| Missouri | 100 index points · start = 100 | |
| Montana | 100 index points · start = 100 | |
| Nebraska | 100 index points · start = 100 | |
| Nevada | 100 index points · start = 100 | |
| New Hampshire | 100 index points · start = 100 | |
| New Jersey | 100 index points · start = 100 | |
| New Mexico | 100 index points · start = 100 | |
| New York | 100 index points · start = 100 | |
| North Carolina | 100 index points · start = 100 | |
| North Dakota | 100 index points · start = 100 | |
| Ohio | 100 index points · start = 100 | |
| Oklahoma | 100 index points · start = 100 | |
| Oregon | 100 index points · start = 100 | |
| Pennsylvania | 100 index points · start = 100 | |
| Rhode Island | 100 index points · start = 100 | |
| South Carolina | 100 index points · start = 100 | |
| South Dakota | 100 index points · start = 100 | |
| Tennessee | 100 index points · start = 100 | |
| Texas | 100 index points · start = 100 | |
| Utah | 100 index points · start = 100 | |
| Vermont | 100 index points · start = 100 | |
| Virginia | 100 index points · start = 100 | |
| Washington | 100 index points · start = 100 | |
| West Virginia | 100 index points · start = 100 | |
| Wisconsin | 100 index points · start = 100 | |
| Wyoming | 100 index points · start = 100 |
Accessible comparison values
Sources, rights & limitations
Source: FHFA HPI® (all-transactions, not seasonally adjusted, nominal); U.S. Census Bureau 2024 Gazetteer. Basemap: Natural Earth (public domain), U.S. Census Bureau/us-atlas (public domain). Ancient Earth uses the reconstructed source-model land instead.
Data release: 2026-10-04. Retrieved 2026-10-04T00:00:00Z. Commercial use: approved. Export rights: approved.
- https://www2.census.gov/geo/docs/maps-data/data/gazetteer/2024_Gazetteer/2024_Gaz_state_national.zip
- https://www2.census.gov/geo/docs/maps-data/data/gazetteer/2024_Gazetteer/2024_Gaz_cbsa_national.zip
- https://www.fhfa.gov/hpi/download/quarterly_datasets/hpi_at_state.txt
- https://www.fhfa.gov/hpi/download/quarterly_datasets/hpi_at_metro.txt
License: https://www.fhfa.gov/faqs/hpi
- FHFA HPI® (all-transactions, not seasonally adjusted, nominal) measures repeat sales and refinance appraisals for single-family properties; the index is not a dollar price, rent, or affordability measure.
- All states/DC and the eight metros use the same quarterly all-transactions series. Metro areas are metropolitan statistical areas, not city limits. No purchase-only, expanded-data or metropolitan-division series are spliced into these records.
- The entire downloaded series uses the current OMB Bulletin 23-01 metropolitan delineations, including older observations. It does not reproduce the boundaries in force in each historical quarter.
- The source may revise historical estimates. This immutable snapshot records the exact downloaded release through 2026 Q2; saved scenes replay this release.
- Start/graduation year resolves to Q1 of a supported year; unavailable dates are visibly resolved. Missing source observations remain unknown. Playback shows quarterly snapshots without inventing intermediate prices.
- Rebased index = 100 × current index / starting index; growth = 100 × (current index / starting index − 1). Both flat and height views use these identical values; heights represent index points, not dollars or building height.
- Values are nominal and contain seasonal effects. No inflation adjustment or income series has been joined; housing growth alone does not establish purchase affordability.
Units: sourceIndex: FHFA all-transactions nominal index, not seasonally adjusted · rebasedIndex: index points, starting quarter = 100 · change: percent since starting quarter.
Immutable manifest and asset checksums · Download normalized source scene