Calculators & maps / Housing
Homeowners Insurance Premiums by State
Compare historical premiums on the same policy form and coverage basis.
NAIC 2023 policy premiums · published 2026 · Source snapshot 2026-10-01
Saved example · 51 source places. Interactive controls load automatically.
51 plotted places. Exact values and identifiers are available in the table and download.
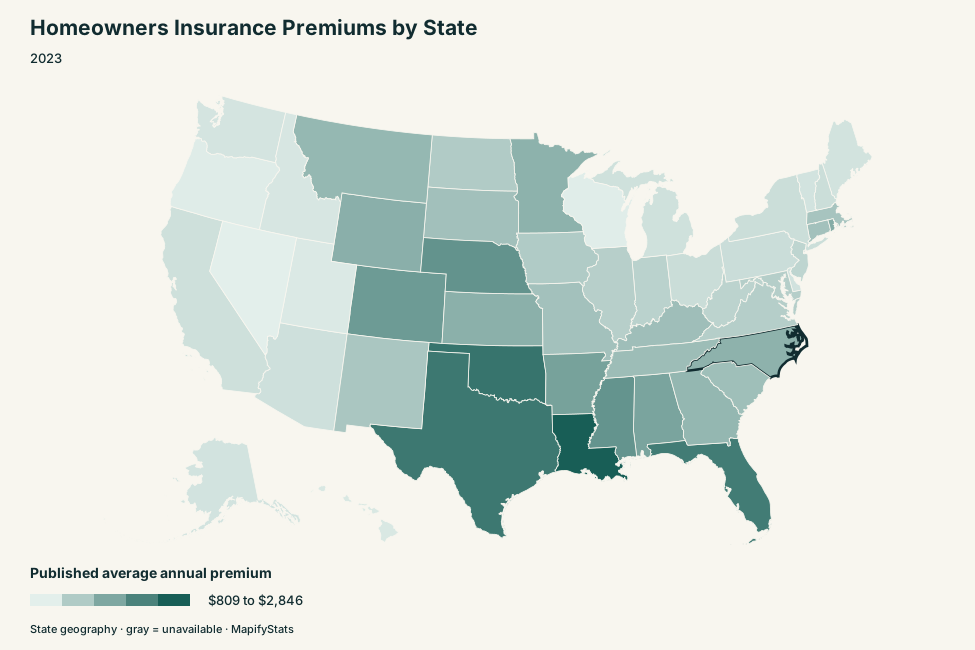
Selected place
North Carolina · NC
$1,665
Published average annual premium · 2023
Geography identifier: NC
- Policy form
- ho3
- Dwelling-coverage band
- $300,000–$324,999
- 2023 average annual premium
- $1,665
- Annual premium / 12
- $138.75
Comparison
Georgia · GA
$1,600
Published average annual premium · 2023
Geography identifier: GA
- Policy form
- ho3
- Dwelling-coverage band
- $300,000–$324,999
- 2023 average annual premium
- $1,600
- Annual premium / 12
- $133.33
Compare places
51 source places. Select a place name to inspect its details.
Scroll horizontally to see every column →
AL | AL | $1,858 | |
AK | AK | $979 | |
AZ | AZ | $1,019 | |
AR | AR | $1,896 | |
CA | CA | $1,024 | |
CO | CO | $1,991 | |
CT | CT | $1,452 | |
DE | DE | $988 | |
DC | DC | $1,088 | |
FL | FL | $2,424 | |
GA | GA | $1,600 | |
HI | HI | $913 | |
ID | ID | $933 | |
IL | IL | $1,255 | |
IN | IN | $1,220 | |
IA | IA | $1,319 | |
KS | KS | $1,697 | |
KY | KY | $1,494 | |
LA | LA | $2,846 | |
ME | ME | $981 | |
MD | MD | $1,268 | |
MA | MA | $1,409 | |
MI | MI | $1,010 | |
MN | MN | $1,669 | |
MS | MS | $2,083 | |
MO | MO | $1,455 | |
MT | MT | $1,588 | |
NE | NE | $2,096 | |
NV | NV | $809 | |
NH | NH | $1,052 | |
NJ | NJ | $1,181 | |
NM | NM | $1,381 | |
NY | NY | $1,051 | |
NC | NC | $1,665 | |
ND | ND | $1,311 | |
OH | OH | $1,062 | |
OK | OK | $2,538 | |
OR | OR | $848 | |
PA | PA | $1,059 | |
RI | RI | $1,755 | |
SC | SC | $1,488 | |
SD | SD | $1,463 | |
TN | TN | $1,515 | |
TX | TX | $2,479 | |
UT | UT | $889 | |
VT | VT | $979 | |
VA | VA | $1,272 | |
WA | WA | $957 | |
WV | WV | $1,202 | |
WI | WI | $842 | |
WY | WY | $1,703 |
How to read this comparison
NAIC Table 4 reports 2023 average annual homeowners premiums. Choose one policy form and the same dwelling-coverage band for both states. Monthly equivalents divide the published annual average by 12; they do not describe insurer billing schedules.
HO-3 and HO-5 are separate policy forms. Coverage amount refers to dwelling coverage rather than a home market-value estimate. All coverage amounts pools policies of different sizes and should not be treated as a matched coverage comparison. Missing or suppressed cells remain unavailable. Historical averages are not current quotes; deductibles, exclusions, property characteristics and insurer mix differ. Source: NAIC Homeowners Insurance Report, 2023 data, published 2026.
Sources and reproducibility
Retrieved 2026-10-01. Original-download and archived-extract SHA-256 checksums and selection rules are preserved in the source manifest. Published missing or suppressed observations remain unavailable.
- insurance-2023.csv — Table 4 2023 HO-3 and HO-5 average annual premiums, same coverage bands, 50 states/DC; values read by aligned PDF columns; suppressed/blank cells unavailable; exact source dollar strings and PDF page retained
Download the complete source snapshot · Download the saved example comparison