U.S. Bureau of Labor Statistics · OEWS May 2025
Electrician Wages by State
The brief: U.S. electricians earned a mean $34.37/hour in May 2025. Oregon led the states at $47.96/hour; Arkansas was lowest at $25.71/hour — a $22.25/hour spread from top to bottom.
Customize this map →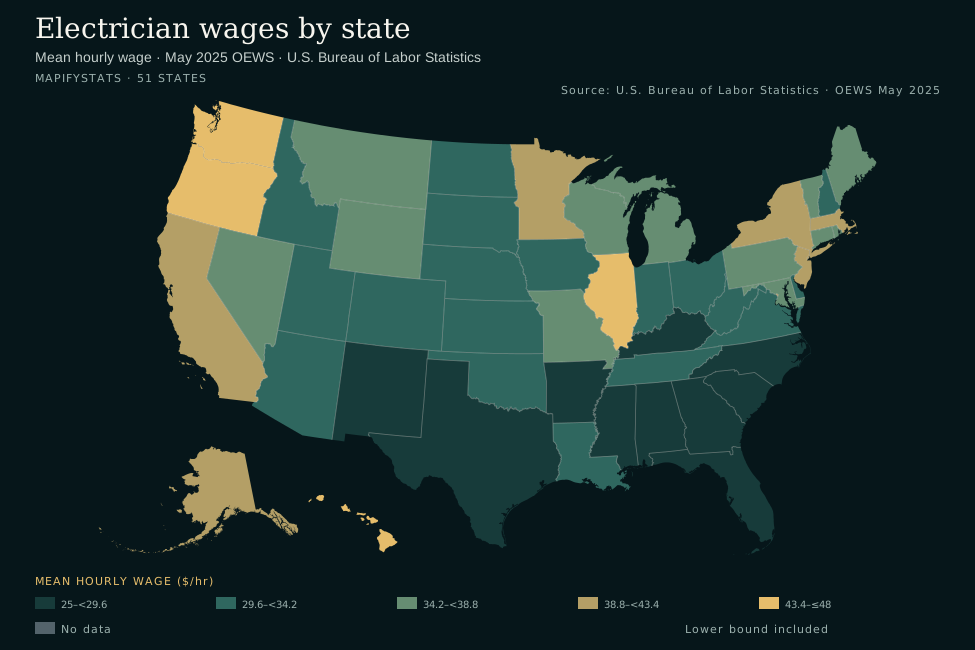
- 25–<29.6
- 29.6–<34.2
- 34.2–<38.8
- 38.8–<43.4
- 43.4–≤48
- No data
- Lower bound included
Where electricians earn the most
Oregon led the 50 states at $47.96/hour (10,590 electricians employed), followed by Washington ($45.42/hour) and Hawaii ($44.65/hour). Arkansas was lowest at $25.71/hour. Rankings compare hourly means; employment counts measure workforce size, not pay.
All 50 states and DC: employment and mean wages
Activate a column heading to sort; activate it again to reverse. Wages display two decimals for hourly and whole dollars for annual; sorting and CSV use source precision.
Scroll the table horizontally to see every column →
| Alabama | 10,900 | $27.65 | $57,510 | 48 |
|---|---|---|---|---|
| Alaska | 1,870 | $43.29 | $90,040 | 5 |
| Arizona | 21,140 | $30.88 | $64,220 | 34 |
| Arkansas | 7,500 | $25.71 | $53,470 | 50 |
| California | 73,310 | $41.28 | $85,860 | 7 |
| Colorado | 17,010 | $31.88 | $66,310 | 31 |
| Connecticut | 7,710 | $37.21 | $77,390 | 11 |
| Delaware | 2,260 | $34.02 | $70,750 | 24 |
| District of Columbia | 2,440 | $42.72 | $88,860 | Unranked |
| Florida | 49,700 | $27.72 | $57,660 | 47 |
| Georgia | 21,650 | $29.37 | $61,090 | 42 |
| Hawaii | 3,070 | $44.65 | $92,870 | 3 |
| Idaho | 5,690 | $32.02 | $66,600 | 30 |
| Illinois | 23,120 | $44.34 | $92,230 | 4 |
| Indiana | 19,020 | $34.05 | $70,820 | 23 |
| Iowa | 10,310 | $30.38 | $63,190 | 38 |
| Kansas | 6,350 | $33.27 | $69,200 | 26 |
| Kentucky | 11,030 | $29.52 | $61,410 | 41 |
| Louisiana | 10,550 | $29.98 | $62,350 | 39 |
| Maine | 3,780 | $37.14 | $77,250 | 12 |
| Maryland | 13,690 | $36.28 | $75,450 | 15 |
| Massachusetts | 17,810 | $39.21 | $81,560 | 9 |
| Michigan | 23,530 | $35.50 | $73,840 | 18 |
| Minnesota | 14,350 | $38.86 | $80,830 | 10 |
| Mississippi | 6,610 | $27.88 | $58,000 | 46 |
| Missouri | 12,780 | $34.77 | $72,310 | 21 |
| Montana | 2,750 | $34.58 | $71,930 | 22 |
| Nebraska | 6,440 | $30.75 | $63,960 | 35 |
| Nevada | 8,350 | $36.40 | $75,710 | 14 |
| New Hampshire | 3,330 | $31.63 | $65,780 | 32 |
| New Jersey | 13,520 | $41.68 | $86,700 | 6 |
| New Mexico | 5,020 | $28.66 | $59,620 | 43 |
| New York | 40,130 | $40.80 | $84,860 | 8 |
| North Carolina | 21,640 | $27.33 | $56,850 | 49 |
| North Dakota | 3,570 | $33.87 | $70,460 | 25 |
| Ohio | 28,950 | $33.09 | $68,840 | 27 |
| Oklahoma | 8,500 | $30.49 | $63,410 | 37 |
| Oregon | 10,590 | $47.96 | $99,750 | 1 |
| Pennsylvania | 22,730 | $36.43 | $75,770 | 13 |
| Rhode Island | 2,420 | $35.65 | $74,150 | 17 |
| South Carolina | 8,010 | $28.38 | $59,030 | 45 |
| South Dakota | 2,980 | $29.80 | $61,980 | 40 |
| Tennessee | 17,070 | $30.55 | $63,540 | 36 |
| Texas | 76,770 | $28.50 | $59,280 | 44 |
| Utah | 11,450 | $31.39 | $65,290 | 33 |
| Vermont | 1,270 | $35.27 | $73,360 | 20 |
| Virginia | 23,630 | $32.62 | $67,850 | 28 |
| Washington | 19,380 | $45.42 | $94,470 | 2 |
| West Virginia | 4,290 | $32.61 | $67,840 | 29 |
| Wisconsin | 14,310 | $35.49 | $73,810 | 19 |
| Wyoming | 2,960 | $35.99 | $74,860 | 16 |
District of Columbia
DC is a federal district, so it is excluded from the 50-state ranking and shown separately here. It is included in the map, customization data and CSV. DC employed 2,440 electricians at a mean $42.72/hour.
What this measures
Mean hourly wage for Electricians (Standard Occupational Classification 47-2111): workers who install, maintain and repair electrical wiring, equipment and fixtures. These are state-level estimates — they do not describe metro areas or cities, and local wages can differ substantially.
OEWS covers wage and salary workers in nonfarm establishments; the self-employed are excluded. The mean annual wage equals the hourly mean × 2,080 hours (a full-time, year-round equivalent), rounded by BLS to the nearest $10. These are survey estimates with sampling error, not a census of every electrician.
Methodology and source
All 51 state/DC records were validated: every mean annual wage matches its hourly mean × 2,080 within BLS rounding, and no values were suppressed. The map uses a sequential palette; higher mean hourly wages appear toward the gold end of the scale. DC is mapped and downloadable but unranked. Puerto Rico, territories and aggregate rows are excluded.
Source: U.S. Bureau of Labor Statistics, Occupational Employment and Wage Statistics, May 2025 (state file: oesm25st.zip; news release USDL-26-0725). Published May 15, 2026; extract retrieved September 30, 2026.
Archived BLS extract (51 rows) · Wage CSV · Data and source checksum
Customize this map →