
Local Data Atlas / Land & outdoors
County Drought History
Explore drought frequency, severity and consecutive-week streaks across counties.
2025 · 6 source periods · Snapshot retrieved 2026-10-02 · Saved example: NC
Saved example · 100 matching places. Interactive filters load automatically.
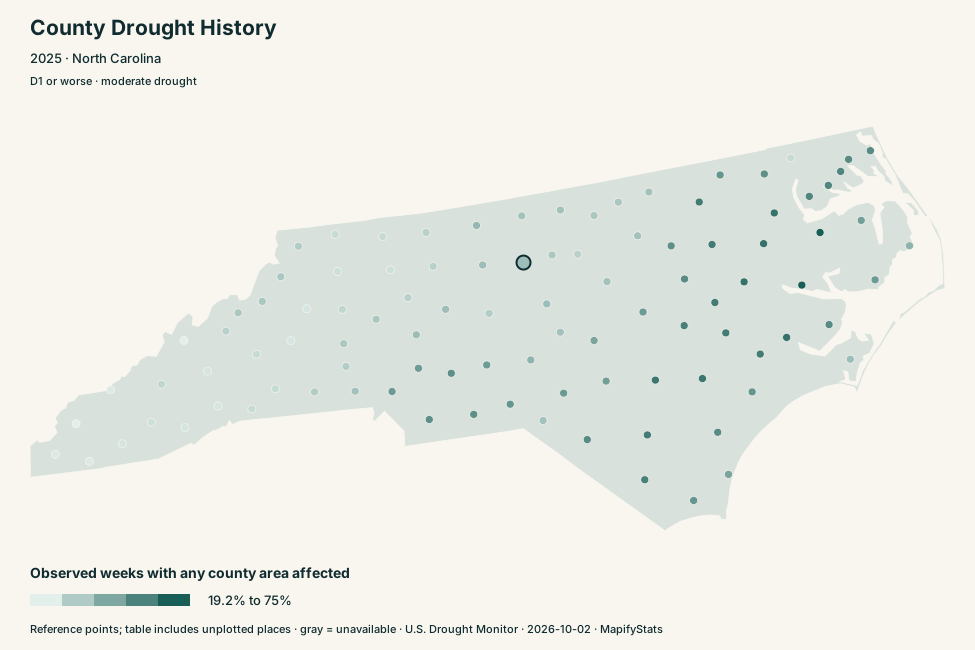
100 plotted of 100 matching places. Observed weeks with any county area affected: 19.2% to 75%. County internal points. Gray means unavailable; exact values follow in the table.
Selected place
Alamance County, NC
37001 · 2025
38.5%
Observed weeks with any county area affected
- Observed weeks with any county area affected
- 38.5%
- Weeks with any county area affected
- 20 weeks
- Longest consecutive streak within selected year
- 12 weeks
- Mean affected county area across observed weeks
- 29.48%
- Maximum affected county area
- 100%
Comparison
Alexander County, NC
37003 · 2025
28.8%
Observed weeks with any county area affected
- Observed weeks with any county area affected
- 28.8%
- Weeks with any county area affected
- 15 weeks
- Longest consecutive streak within selected year
- 9 weeks
- Mean affected county area across observed weeks
- 22.57%
- Maximum affected county area
- 100%
Weekly drought area in the selected year
County area at selected severity or worse · missing observations break the line
- Alamance County, NC
- Alexander County, NC
Show exact timeline values
| Period | Alamance County, NC | Alexander County, NC |
|---|---|---|
| 2025-01-07 | 0% | 0% |
| 2025-01-14 | 7.23% | 0% |
| 2025-01-21 | 100% | 0% |
| 2025-01-28 | 100% | 57.38% |
| 2025-02-04 | 100% | 57.38% |
| 2025-02-11 | 100% | 57.38% |
| 2025-02-18 | 0% | 0% |
| 2025-02-25 | 0% | 0% |
| 2025-03-04 | 0% | 0% |
| 2025-03-11 | 0% | 0.87% |
| 2025-03-18 | 0% | 0.87% |
| 2025-03-25 | 0% | 100% |
| 2025-04-01 | 53.66% | 100% |
| 2025-04-08 | 0% | 100% |
| 2025-04-15 | 0% | 100% |
| 2025-04-22 | 0% | 100% |
| 2025-04-29 | 41.52% | 100% |
| 2025-05-06 | 0% | 100% |
| 2025-05-13 | 0% | 0% |
| 2025-05-20 | 0% | 0% |
| 2025-05-27 | 0% | 0% |
| 2025-06-03 | 0% | 0% |
| 2025-06-10 | 0% | 0% |
| 2025-06-17 | 0% | 0% |
| 2025-06-24 | 0% | 0% |
| 2025-07-01 | 0% | 0% |
| 2025-07-08 | 0% | 0% |
| 2025-07-15 | 0% | 0% |
| 2025-07-22 | 0% | 0% |
| 2025-07-29 | 0% | 0% |
| 2025-08-05 | 0% | 0% |
| 2025-08-12 | 0% | 0% |
| 2025-08-19 | 0% | 0% |
| 2025-08-26 | 0% | 0% |
| 2025-09-02 | 0% | 0% |
| 2025-09-09 | 0% | 0% |
| 2025-09-16 | 0% | 0% |
| 2025-09-23 | 8.33% | 0% |
| 2025-09-30 | 0% | 0% |
| 2025-10-07 | 0% | 0% |
| 2025-10-14 | 73.59% | 0% |
| 2025-10-21 | 100% | 0% |
| 2025-10-28 | 100% | 0% |
| 2025-11-04 | 24.36% | 0% |
| 2025-11-11 | 24.36% | 0% |
| 2025-11-18 | 100% | 0% |
| 2025-11-25 | 100% | 0% |
| 2025-12-02 | 100% | 0% |
| 2025-12-09 | 100% | 0% |
| 2025-12-16 | 100% | 100% |
| 2025-12-23 | 100% | 100% |
| 2025-12-30 | 100% | 100% |
Compare the source periods
Observed weeks with any county area affected · missing observations break the line
- Alamance County, NC
- Alexander County, NC
Show exact timeline values
| Period | Alamance County, NC | Alexander County, NC |
|---|---|---|
| 2020 | 0% | 0% |
| 2021 | 15.4% | 13.5% |
| 2022 | 1.9% | 9.6% |
| 2023 | 13.5% | 23.1% |
| 2024 | 13.2% | 11.3% |
| 2025 | 38.5% | 28.8% |
Compare the data
Choose a place name to inspect its profile. CSV downloads include every matching row; the table shows 40 rows at a time.
Scroll horizontally to see every column →
| Place | Identifier | State | Observed weeks with any county area affected |
|---|---|---|---|
| Beaufort County | 37013 | NC | 75% |
| Washington County | 37187 | NC | 75% |
| Bertie County | 37015 | NC | 67.3% |
| Craven County | 37049 | NC | 67.3% |
| Martin County | 37117 | NC | 67.3% |
| Pitt County | 37147 | NC | 67.3% |
| Duplin County | 37061 | NC | 65.4% |
| Sampson County | 37163 | NC | 65.4% |
| Bladen County | 37017 | NC | 63.5% |
| Edgecombe County | 37065 | NC | 63.5% |
| Greene County | 37079 | NC | 63.5% |
| Halifax County | 37083 | NC | 63.5% |
| Jones County | 37103 | NC | 63.5% |
| Lenoir County | 37107 | NC | 63.5% |
| Columbus County | 37047 | NC | 61.5% |
| Wayne County | 37191 | NC | 61.5% |
| Chowan County | 37041 | NC | 59.6% |
| Pasquotank County | 37139 | NC | 59.6% |
| Perquimans County | 37143 | NC | 59.6% |
| Camden County | 37029 | NC | 57.7% |
| Currituck County | 37053 | NC | 57.7% |
| Pamlico County | 37137 | NC | 57.7% |
| Pender County | 37141 | NC | 57.7% |
| Robeson County | 37155 | NC | 57.7% |
| Wilson County | 37195 | NC | 57.7% |
| Anson County | 37007 | NC | 55.8% |
| Hertford County | 37091 | NC | 55.8% |
| Nash County | 37127 | NC | 55.8% |
| Stanly County | 37167 | NC | 55.8% |
| Union County | 37179 | NC | 55.8% |
| Brunswick County | 37019 | NC | 53.8% |
| Northampton County | 37131 | NC | 53.8% |
| Onslow County | 37133 | NC | 53.8% |
| Richmond County | 37153 | NC | 53.8% |
| Cabarrus County | 37025 | NC | 51.9% |
| Hoke County | 37093 | NC | 51.9% |
| Hyde County | 37095 | NC | 51.9% |
| Johnston County | 37101 | NC | 51.9% |
| Mecklenburg County | 37119 | NC | 51.9% |
| Montgomery County | 37123 | NC | 51.9% |
How to read these numbers
US Drought Monitor weekly cumulative area percentages for 2020–2025. A drought week means any county area above 0% at the selected threshold; it does not mean the entire county is affected. Frequency divides affected weeks by observed weekly maps. Streaks reset at missing weeks and the calendar-year boundary. D0 is abnormally dry, not drought. Area is distinct from population, water supply and future drought risk. The selected-county weekly timeline retains real source percentages.
Map colors span the minimum and maximum available values in your current filters. Point maps locate reference points and do not shade geographic boundaries. Nearby ordering uses straight-line point distance, not a travel route. Public links preserve statistical filters and place identifiers; calculation amounts and search text stay out of the URL.
Sources and reproducibility
Retrieved 2026-10-02. Archived extracts, original-download SHA-256 checksums and exact selection rules are preserved in the source manifest. Normal builds use these saved files offline.
Download the saved source snapshot · Download the saved comparison CSV
Download other state snapshots (51)
- AK · 30 source places
- AL · 67 source places
- AR · 75 source places
- AZ · 15 source places
- CA · 58 source places
- CO · 64 source places
- CT · 9 source places
- DC · 1 source places
- DE · 3 source places
- FL · 67 source places
- GA · 159 source places
- HI · 5 source places
- IA · 99 source places
- ID · 44 source places
- IL · 102 source places
- IN · 92 source places
- KS · 105 source places
- KY · 120 source places
- LA · 64 source places
- MA · 14 source places
- MD · 24 source places
- ME · 16 source places
- MI · 83 source places
- MN · 87 source places
- MO · 115 source places
- MS · 82 source places
- MT · 56 source places
- NC · 100 source places
- ND · 53 source places
- NE · 93 source places
- NH · 10 source places
- NJ · 21 source places
- NM · 33 source places
- NV · 17 source places
- NY · 62 source places
- OH · 88 source places
- OK · 77 source places
- OR · 36 source places
- PA · 67 source places
- RI · 5 source places
- SC · 46 source places
- SD · 66 source places
- TN · 95 source places
- TX · 254 source places
- UT · 29 source places
- VA · 133 source places
- VT · 14 source places
- WA · 39 source places
- WI · 72 source places
- WV · 55 source places
- WY · 23 source places
Agency sources and archived files (51)
- drought-history-AK.csv · official source · Archived file
Unchanged county percent-of-area traditional (cumulative D0–D4) weekly statistics, 2020–2025. Query dates may return a boundary week; normalization keeps map dates in the requested calendar years only.
- drought-history-AL.csv.gz · official source · Archived file
Unchanged county percent-of-area traditional (cumulative D0–D4) weekly statistics, 2020–2025. Query dates may return a boundary week; normalization keeps map dates in the requested calendar years only. Archived losslessly as gzip; uncompressedSha256 identifies extracted content.
- drought-history-AR.csv.gz · official source · Archived file
Unchanged county percent-of-area traditional (cumulative D0–D4) weekly statistics, 2020–2025. Query dates may return a boundary week; normalization keeps map dates in the requested calendar years only. Archived losslessly as gzip; uncompressedSha256 identifies extracted content.
- drought-history-AZ.csv · official source · Archived file
Unchanged county percent-of-area traditional (cumulative D0–D4) weekly statistics, 2020–2025. Query dates may return a boundary week; normalization keeps map dates in the requested calendar years only.
- drought-history-CA.csv.gz · official source · Archived file
Unchanged county percent-of-area traditional (cumulative D0–D4) weekly statistics, 2020–2025. Query dates may return a boundary week; normalization keeps map dates in the requested calendar years only. Archived losslessly as gzip; uncompressedSha256 identifies extracted content.
- drought-history-CO.csv.gz · official source · Archived file
Unchanged county percent-of-area traditional (cumulative D0–D4) weekly statistics, 2020–2025. Query dates may return a boundary week; normalization keeps map dates in the requested calendar years only. Archived losslessly as gzip; uncompressedSha256 identifies extracted content.
- drought-history-CT.csv · official source · Archived file
Unchanged county percent-of-area traditional (cumulative D0–D4) weekly statistics, 2020–2025. Query dates may return a boundary week; normalization keeps map dates in the requested calendar years only.
- drought-history-DC.csv · official source · Archived file
Unchanged county percent-of-area traditional (cumulative D0–D4) weekly statistics, 2020–2025. Query dates may return a boundary week; normalization keeps map dates in the requested calendar years only.
- drought-history-DE.csv · official source · Archived file
Unchanged county percent-of-area traditional (cumulative D0–D4) weekly statistics, 2020–2025. Query dates may return a boundary week; normalization keeps map dates in the requested calendar years only.
- drought-history-FL.csv.gz · official source · Archived file
Unchanged county percent-of-area traditional (cumulative D0–D4) weekly statistics, 2020–2025. Query dates may return a boundary week; normalization keeps map dates in the requested calendar years only. Archived losslessly as gzip; uncompressedSha256 identifies extracted content.
- drought-history-GA.csv.gz · official source · Archived file
Unchanged county percent-of-area traditional (cumulative D0–D4) weekly statistics, 2020–2025. Query dates may return a boundary week; normalization keeps map dates in the requested calendar years only. Archived losslessly as gzip; uncompressedSha256 identifies extracted content.
- drought-history-HI.csv · official source · Archived file
Unchanged county percent-of-area traditional (cumulative D0–D4) weekly statistics, 2020–2025. Query dates may return a boundary week; normalization keeps map dates in the requested calendar years only.
- drought-history-IA.csv.gz · official source · Archived file
Unchanged county percent-of-area traditional (cumulative D0–D4) weekly statistics, 2020–2025. Query dates may return a boundary week; normalization keeps map dates in the requested calendar years only. Archived losslessly as gzip; uncompressedSha256 identifies extracted content.
- drought-history-ID.csv.gz · official source · Archived file
Unchanged county percent-of-area traditional (cumulative D0–D4) weekly statistics, 2020–2025. Query dates may return a boundary week; normalization keeps map dates in the requested calendar years only. Archived losslessly as gzip; uncompressedSha256 identifies extracted content.
- drought-history-IL.csv.gz · official source · Archived file
Unchanged county percent-of-area traditional (cumulative D0–D4) weekly statistics, 2020–2025. Query dates may return a boundary week; normalization keeps map dates in the requested calendar years only. Archived losslessly as gzip; uncompressedSha256 identifies extracted content.
- drought-history-IN.csv.gz · official source · Archived file
Unchanged county percent-of-area traditional (cumulative D0–D4) weekly statistics, 2020–2025. Query dates may return a boundary week; normalization keeps map dates in the requested calendar years only. Archived losslessly as gzip; uncompressedSha256 identifies extracted content.
- drought-history-KS.csv.gz · official source · Archived file
Unchanged county percent-of-area traditional (cumulative D0–D4) weekly statistics, 2020–2025. Query dates may return a boundary week; normalization keeps map dates in the requested calendar years only. Archived losslessly as gzip; uncompressedSha256 identifies extracted content.
- drought-history-KY.csv.gz · official source · Archived file
Unchanged county percent-of-area traditional (cumulative D0–D4) weekly statistics, 2020–2025. Query dates may return a boundary week; normalization keeps map dates in the requested calendar years only. Archived losslessly as gzip; uncompressedSha256 identifies extracted content.
- drought-history-LA.csv.gz · official source · Archived file
Unchanged county percent-of-area traditional (cumulative D0–D4) weekly statistics, 2020–2025. Query dates may return a boundary week; normalization keeps map dates in the requested calendar years only. Archived losslessly as gzip; uncompressedSha256 identifies extracted content.
- drought-history-MA.csv · official source · Archived file
Unchanged county percent-of-area traditional (cumulative D0–D4) weekly statistics, 2020–2025. Query dates may return a boundary week; normalization keeps map dates in the requested calendar years only.
- drought-history-MD.csv · official source · Archived file
Unchanged county percent-of-area traditional (cumulative D0–D4) weekly statistics, 2020–2025. Query dates may return a boundary week; normalization keeps map dates in the requested calendar years only.
- drought-history-ME.csv · official source · Archived file
Unchanged county percent-of-area traditional (cumulative D0–D4) weekly statistics, 2020–2025. Query dates may return a boundary week; normalization keeps map dates in the requested calendar years only.
- drought-history-MI.csv.gz · official source · Archived file
Unchanged county percent-of-area traditional (cumulative D0–D4) weekly statistics, 2020–2025. Query dates may return a boundary week; normalization keeps map dates in the requested calendar years only. Archived losslessly as gzip; uncompressedSha256 identifies extracted content.
- drought-history-MN.csv.gz · official source · Archived file
Unchanged county percent-of-area traditional (cumulative D0–D4) weekly statistics, 2020–2025. Query dates may return a boundary week; normalization keeps map dates in the requested calendar years only. Archived losslessly as gzip; uncompressedSha256 identifies extracted content.
- drought-history-MO.csv.gz · official source · Archived file
Unchanged county percent-of-area traditional (cumulative D0–D4) weekly statistics, 2020–2025. Query dates may return a boundary week; normalization keeps map dates in the requested calendar years only. Archived losslessly as gzip; uncompressedSha256 identifies extracted content.
- drought-history-MS.csv.gz · official source · Archived file
Unchanged county percent-of-area traditional (cumulative D0–D4) weekly statistics, 2020–2025. Query dates may return a boundary week; normalization keeps map dates in the requested calendar years only. Archived losslessly as gzip; uncompressedSha256 identifies extracted content.
- drought-history-MT.csv.gz · official source · Archived file
Unchanged county percent-of-area traditional (cumulative D0–D4) weekly statistics, 2020–2025. Query dates may return a boundary week; normalization keeps map dates in the requested calendar years only. Archived losslessly as gzip; uncompressedSha256 identifies extracted content.
- drought-history-NC.csv.gz · official source · Archived file
Unchanged county percent-of-area traditional (cumulative D0–D4) weekly statistics, 2020–2025. Query dates may return a boundary week; normalization keeps map dates in the requested calendar years only. Archived losslessly as gzip; uncompressedSha256 identifies extracted content.
- drought-history-ND.csv.gz · official source · Archived file
Unchanged county percent-of-area traditional (cumulative D0–D4) weekly statistics, 2020–2025. Query dates may return a boundary week; normalization keeps map dates in the requested calendar years only. Archived losslessly as gzip; uncompressedSha256 identifies extracted content.
- drought-history-NE.csv.gz · official source · Archived file
Unchanged county percent-of-area traditional (cumulative D0–D4) weekly statistics, 2020–2025. Query dates may return a boundary week; normalization keeps map dates in the requested calendar years only. Archived losslessly as gzip; uncompressedSha256 identifies extracted content.
- drought-history-NH.csv · official source · Archived file
Unchanged county percent-of-area traditional (cumulative D0–D4) weekly statistics, 2020–2025. Query dates may return a boundary week; normalization keeps map dates in the requested calendar years only.
- drought-history-NJ.csv · official source · Archived file
Unchanged county percent-of-area traditional (cumulative D0–D4) weekly statistics, 2020–2025. Query dates may return a boundary week; normalization keeps map dates in the requested calendar years only.
- drought-history-NM.csv · official source · Archived file
Unchanged county percent-of-area traditional (cumulative D0–D4) weekly statistics, 2020–2025. Query dates may return a boundary week; normalization keeps map dates in the requested calendar years only.
- drought-history-NV.csv · official source · Archived file
Unchanged county percent-of-area traditional (cumulative D0–D4) weekly statistics, 2020–2025. Query dates may return a boundary week; normalization keeps map dates in the requested calendar years only.
- drought-history-NY.csv.gz · official source · Archived file
Unchanged county percent-of-area traditional (cumulative D0–D4) weekly statistics, 2020–2025. Query dates may return a boundary week; normalization keeps map dates in the requested calendar years only. Archived losslessly as gzip; uncompressedSha256 identifies extracted content.
- drought-history-OH.csv.gz · official source · Archived file
Unchanged county percent-of-area traditional (cumulative D0–D4) weekly statistics, 2020–2025. Query dates may return a boundary week; normalization keeps map dates in the requested calendar years only. Archived losslessly as gzip; uncompressedSha256 identifies extracted content.
- drought-history-OK.csv.gz · official source · Archived file
Unchanged county percent-of-area traditional (cumulative D0–D4) weekly statistics, 2020–2025. Query dates may return a boundary week; normalization keeps map dates in the requested calendar years only. Archived losslessly as gzip; uncompressedSha256 identifies extracted content.
- drought-history-OR.csv · official source · Archived file
Unchanged county percent-of-area traditional (cumulative D0–D4) weekly statistics, 2020–2025. Query dates may return a boundary week; normalization keeps map dates in the requested calendar years only.
- drought-history-PA.csv.gz · official source · Archived file
Unchanged county percent-of-area traditional (cumulative D0–D4) weekly statistics, 2020–2025. Query dates may return a boundary week; normalization keeps map dates in the requested calendar years only. Archived losslessly as gzip; uncompressedSha256 identifies extracted content.
- drought-history-RI.csv · official source · Archived file
Unchanged county percent-of-area traditional (cumulative D0–D4) weekly statistics, 2020–2025. Query dates may return a boundary week; normalization keeps map dates in the requested calendar years only.
- drought-history-SC.csv.gz · official source · Archived file
Unchanged county percent-of-area traditional (cumulative D0–D4) weekly statistics, 2020–2025. Query dates may return a boundary week; normalization keeps map dates in the requested calendar years only. Archived losslessly as gzip; uncompressedSha256 identifies extracted content.
- drought-history-SD.csv.gz · official source · Archived file
Unchanged county percent-of-area traditional (cumulative D0–D4) weekly statistics, 2020–2025. Query dates may return a boundary week; normalization keeps map dates in the requested calendar years only. Archived losslessly as gzip; uncompressedSha256 identifies extracted content.
- drought-history-TN.csv.gz · official source · Archived file
Unchanged county percent-of-area traditional (cumulative D0–D4) weekly statistics, 2020–2025. Query dates may return a boundary week; normalization keeps map dates in the requested calendar years only. Archived losslessly as gzip; uncompressedSha256 identifies extracted content.
- drought-history-TX.csv.gz · official source · Archived file
Unchanged county percent-of-area traditional (cumulative D0–D4) weekly statistics, 2020–2025. Query dates may return a boundary week; normalization keeps map dates in the requested calendar years only. Archived losslessly as gzip; uncompressedSha256 identifies extracted content.
- drought-history-UT.csv · official source · Archived file
Unchanged county percent-of-area traditional (cumulative D0–D4) weekly statistics, 2020–2025. Query dates may return a boundary week; normalization keeps map dates in the requested calendar years only.
- drought-history-VA.csv.gz · official source · Archived file
Unchanged county percent-of-area traditional (cumulative D0–D4) weekly statistics, 2020–2025. Query dates may return a boundary week; normalization keeps map dates in the requested calendar years only. Archived losslessly as gzip; uncompressedSha256 identifies extracted content.
- drought-history-VT.csv · official source · Archived file
Unchanged county percent-of-area traditional (cumulative D0–D4) weekly statistics, 2020–2025. Query dates may return a boundary week; normalization keeps map dates in the requested calendar years only.
- drought-history-WA.csv.gz · official source · Archived file
Unchanged county percent-of-area traditional (cumulative D0–D4) weekly statistics, 2020–2025. Query dates may return a boundary week; normalization keeps map dates in the requested calendar years only. Archived losslessly as gzip; uncompressedSha256 identifies extracted content.
- drought-history-WI.csv.gz · official source · Archived file
Unchanged county percent-of-area traditional (cumulative D0–D4) weekly statistics, 2020–2025. Query dates may return a boundary week; normalization keeps map dates in the requested calendar years only. Archived losslessly as gzip; uncompressedSha256 identifies extracted content.
- drought-history-WV.csv.gz · official source · Archived file
Unchanged county percent-of-area traditional (cumulative D0–D4) weekly statistics, 2020–2025. Query dates may return a boundary week; normalization keeps map dates in the requested calendar years only. Archived losslessly as gzip; uncompressedSha256 identifies extracted content.
- drought-history-WY.csv · official source · Archived file
Unchanged county percent-of-area traditional (cumulative D0–D4) weekly statistics, 2020–2025. Query dates may return a boundary week; normalization keeps map dates in the requested calendar years only.