
MAPIFYSTATS / ANIMATED MAPS / 10
The Shrinking World
The same journey, through three eras. Compare researched historical journeys, dated transport networks and documented costs, waits and assumptions.
Timings: Pennsylvania Journal1766 (Trenton Historical Society transcription), Smithsonian John Bull benchmark, Amtrak2150 Sep30,2026. Diagram and arithmetic: MapifyStats. · Source release, rights & limitations
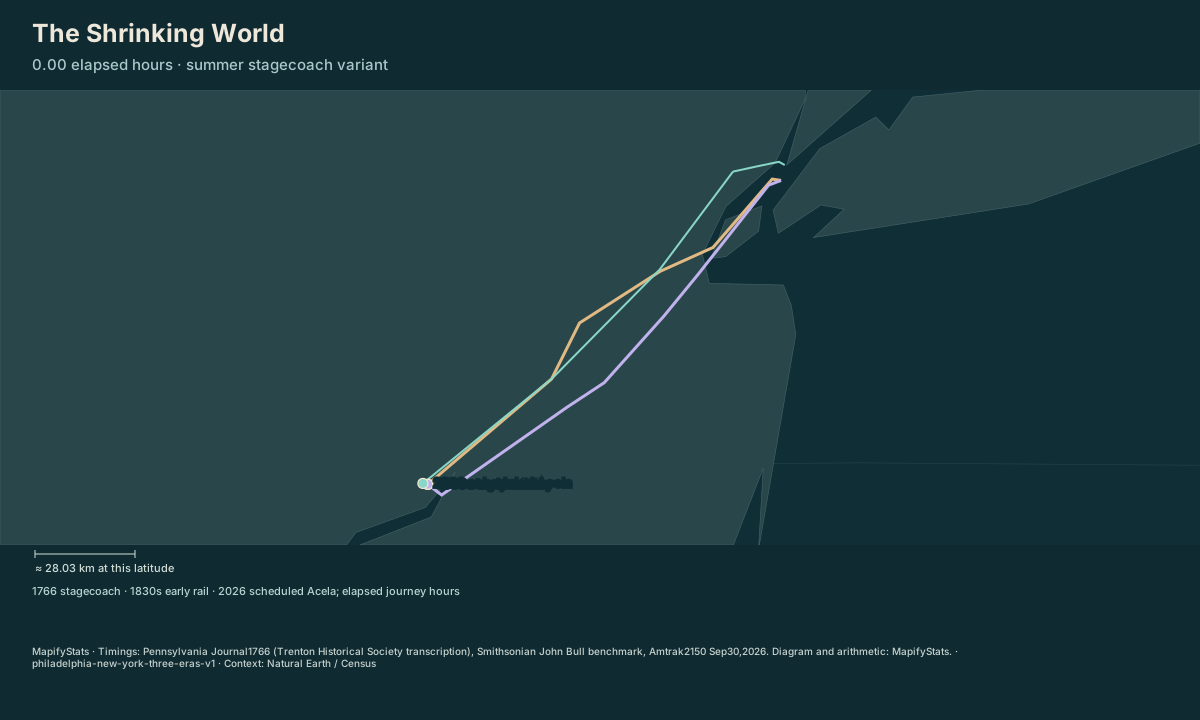
Philadelphia → New York: 1766 stagecoach: 48.00 elapsed hours; 1830s early railway: 5.00 elapsed hours; 2026 scheduled Acela: 1.45 elapsed hours. Replay uses a logarithmic time budget; dots illustrate corridor progress rather than observed intermediate positions.
| Place / record | Value | Definition |
|---|---|---|
| 1766 stagecoach | 48 elapsed hours | |
| 1830s early railway | 5 elapsed hours | |
| 2026 scheduled Acela | 1.45 elapsed hours |
The opening frame and source values work without JavaScript. Enable JavaScript to play, select places, compare or export.
Timings: Pennsylvania Journal1766 (Trenton Historical Society transcription), Smithsonian John Bull benchmark, Amtrak2150 Sep30,2026. Diagram and arithmetic: MapifyStats. · Source release, rights & limitations
Start each traveler at its model's departure from Philadelphia. These are three documented corridor examples, with different evidence precision.
Timings: Pennsylvania Journal1766 (Trenton Historical Society transcription), Smithsonian John Bull benchmark, Amtrak2150 Sep30,2026. Diagram and arithmetic: MapifyStats. · Source release, rights & limitations
Synchronized comparison
Both maps share replay progress and geographic scale. Source periods appear in each title.
What the map shows
Philadelphia → New York: 1766 stagecoach: 48.00 elapsed hours; 1830s early railway: 5.00 elapsed hours; 2026 scheduled Acela: 1.45 elapsed hours. Replay uses a logarithmic time budget; dots illustrate corridor progress rather than observed intermediate positions.
Drag to explore; manual map movement releases guided following. Particle movement and travel progress are illustrative. Attribution stays with every exported image.
Share this replay
Links include your selected public places, time, camera and exact source version. Review your selections before sharing.
Browser video recording is best effort, at 12 fps. A poster remains available when video capture is unsupported.
Accessible source values
| Place / record | Value | Definition |
|---|---|---|
| 1766 stagecoach | 48 elapsed hours | |
| 1830s early railway | 5 elapsed hours | |
| 2026 scheduled Acela | 1.45 elapsed hours |
Accessible comparison values
Sources, rights & limitations
Timings: Pennsylvania Journal1766 (Trenton Historical Society transcription), Smithsonian John Bull benchmark, Amtrak2150 Sep30,2026. Diagram and arithmetic: MapifyStats. Basemap: Natural Earth (public domain), U.S. Census Bureau/us-atlas (public domain). Ancient Earth uses the reconstructed source-model land instead.
Data release: philadelphia-new-york-three-eras-v1. Retrieved 2026-10-04. Commercial use: approved. Export rights: approved-with-source-attribution.
- https://www.trentonhistory.org/His/transportation.html
- https://americanhistory.si.edu/press/fact-sheets/landmark-object-john-bull-locomotive
- https://content.amtrak.com/content/timetable/Acela.pdf
- https://www.loc.gov/item/01021358/
License: Original MapifyStats synthesis of factual timings and hand-authored corridor diagrams; source images, prose, logos and protected timetable layout are excluded. LoC1849 guide is public domain.
- Three specific corridor models, not a global speed surface or a complete transport network.
- Travel durations come from advertised or institutional benchmarks and one dated modern timetable. Their different precision is labeled.
- Historical terminals and modern stations differ. The comparison is between cities, excluding access and boarding costs.
- Moving dots illustrate progress along sourced corridors; intermediate historical arrival positions are not observations.
- The summer/winter control changes only the documented1766 stagecoach variant. The other models retain their dated or aggregate benchmark.
- Reverse journeys, arbitrary destinations and missing service dates are unsupported rather than assigned a uniform speed.
Units: travel: elapsed minutes · summary: elapsed hours · coordinates: longitude, latitude degrees.
Immutable manifest and asset checksums · Download normalized source scene